Download
1 / 65
650 likes | 708 Views
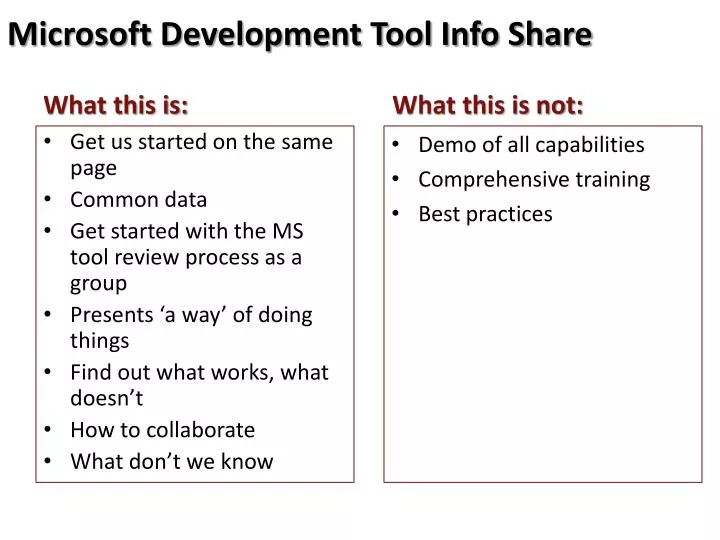
Microsoft Development Tool Info Share. What this is:. What this is not:. Get us started on the same page Common data Get started with the MS tool review process as a group Presents ‘a way’ of doing things Find out what works, what doesn’t How to collaborate What don’t we know.

E N D
Microsoft Development Tool Info Share What this is: What this is not: • Get us started on the same page • Common data • Get started with the MS tool review process as a group • Presents ‘a way’ of doing things • Find out what works, what doesn’t • How to collaborate • What don’t we know • Demo of all capabilities • Comprehensive training • Best practices
Link to SharePoint 2010 Dev site http://dev.iuspug.iu.edu/sites/bi/Pages/Default.aspx SharePoint 2010 SharePoint 2010 Business Intelligence Center PowerPivot Content BI Intelligence Center Access Dashboards Hover over this: To reveal PerformancePoint Services Link Access Performance-Point Content
SharePoint 2010 • Breadcrumbs
Sample Cube Data for the Tools Evaluation Sql Server • Confluence link to overview document: • https://uisapp2.iu.edu/confluence-prd/display/EDW/Sample+Cube+Data+for+the+Tools+Evaluation Account Manager test cube The database for this cube is named AccountsToolsEval and the cube itself is called Accounts. IUIE Job Log test cube The database for this cube is named IUIE Job Log and the cube itself is called Job Log. Student Head Count test cube The database for this cube is named StudentHeadCount and the cube itself is called HeadcountFromCensus.
Sample Cube Data Account Manager Project Link to BI project site in SharePoint: https://sp.indiana.edu/sites/IUBII/p3/am/default.aspx Link to project profile document: https://sp.indiana.edu/sites/IUBII/p3/am/Shared%20Documents/BI%20project%20profile%20research.docx
Sample Cube Data IU Job Log Not associated with any current BI project
Sample Cube Data Retention Project Link to BI project site in SharePoint: https://sp.indiana.edu/sites/IUBII/p3/re/default.aspx Link to project profile document: https://sp.indiana.edu/sites/IUBII/p3/re/Shared%20Documents/BIRetentionprojectSubmission.doc
Sample Cube Data for the Tools Evaluation Oracle • TBD
PowerPivot Links • Home http://www.powerpivot.com/ • PowerPivot videos http://www.powerpivot.com/videos.aspx • PowerPivot demos http://www.powerpivot.com/demo.aspx • PowerPivothands on lab https://cmg.vlabcenter.com/default.aspx?moduleid=ad3bd3e9-8d2b-498d-94fa-e41e1b09730d • Download PowerPivot32 bit version http://go.microsoft.com/fwlink/?LinkId=186058&clcid=0x409
PowerPivot Getting Ready: • Download PowerPivot • Install PowerPivot add-in for Excel Importing Data: • Open a new spreadsheet • Select PowerPivot tab • Select PowerPivot Window Launch • Select From Database -> From Analysis Services or PowerPivot • Select server & database where cube resides • In design view drag & drop measures & dimensions into preview panel on right Creating the Pivot Table: • Select PivotTable -> PivotTable • Drag & drop measure & dimensions into PowerPivot Field List
PowerPivot Installing PowerPivot • To initiate a download of the software, go to: http://go.microsoft.com/fwlink/?LinkId=186058&clcid=0x409 • Once the file has downloaded, click to install. You will need to have administrator rights on your computer to install this • Click “Run” to execute the file
PowerPivot • Click “Next” to continue • Accept the terms of the license agreement and click “Next”. • Enter your name and company if applicable and click “Next” Click “Install” to begin the installation • Click “Yes” if you are asked whether to allow the installation. The install will take a few minutes to run • Once complete, you will see the window on the right • Click “Finish” to complete the installation
PowerPivot • The next time you start Excel it will load the PowerPivotsoftware • Click “Install” • You should see a new tab in Excel called “PowerPivot”
PowerPivot Using PowerPivot • Open a new spreadsheet • Select the PowerPivot tab • Then select the PowerPivot Window Launch
PowerPivot • Select From Database • Select ‘From Analysis Services or PowerPivot
PowerPivot • Enter server name: • EDSS-DEV-PC • Select the database: • Accounts Tool Eval, • IUIE Job Log, or • StudentHeadCount • Select test connection • (not shown) • Select Next
PowerPivot • Enter a query name • Select Design
PowerPivot • Drag & drop measures & dimensions • OK • Finish Drag from here Drop here
PowerPivot • Your data will import • The data sheet will appear
PowerPivot • Select the type of pivot table you want • Select where to put the pivot table
PowerPivot • Drag & drop row labels, column labels and values • You want to change ‘Count’ to ‘Sum’ Notice the aggregation method is defaulted to ‘Count’, and ‘Sum’ is not an option
PowerPivot • It has defaulted to a data type of text • Select PowerPivot • Select PowerPivot Window Launch
PowerPivot • Select the column to change • Select Data Type • Select Whole Number (for this example) • Then Save the document • You will return to the pivot table Note that windows will display a tab for PowerPivot and a tab for your spreadsheet
PowerPivot • To enable Classic Pivot Table layout: • Under PivotTable Tools, select Options • Select Options • Select Options again • Select Display Tab • Select Classic PivotTable Layout 1 2 3 4 5
PowerPivot • Open SharePoint 2010 • http://dev.iuspug.iu.edu/sites/bi/Pages/Default.aspx • Select PowerPivot tab • Select the PowerPivotGallery • Select Upload Document • Browse to your spreadsheet • Click ‘OK’
Dashboard Designer Links • Video: Creating Dashboards as easy as One, Two, Three - An Introduction to PerformancePoint Services • \\ads\ses\University_Share\Technology_Services\SharePoint_Conference\Video\Creating Dashboards as easy as One, Two, Three - An Introduction to PerformancePoint Services.wmv
Link to SharePoint 2010 Dev site http://dev.iuspug.iu.edu/sites/bi/Pages/Default.aspx SharePoint 2010 SharePoint 2010 Business Intelligence Center BI Intelligence Center • Click on ‘Start using PerformancePoint Services’ Hover over this: To reveal PerformancePoint Services Link
Dashboard Designer • Select ‘Run Dashboard Designer’
Dashboard Designer • Notice DD opens in a new window • Data Connections selected by default • Existing Data Connections are displayed • Select PP Content • PP Content is displayed
Dashboard Designer • Right click on Data Connections • Select New Data Source • Select a Template • Use Analysis Services for our test cubes
Dashboard Designer • A form appears to fill in the connection settings • For our purposes use ‘EDSS-DEV-PC’ as the server name • This is what the connection settings look like for the Accounts cube in the AccountMgr database
Dashboard Designer • Right click on PP Content • Select New • Select Report • Select a Report Template • Analytic Grid for a basic table format
Dashboard Designer • Select a Data Source • Select Finish
Dashboard Designer • Name your report • Data delivered by the Data Source is displayed under Details on the right
Dashboard Designer • Drag & Drop Measures & Dimensions • Change until satisfied • Save the Report
Dashboard Designer • Back to PP content • Report has been added
Dashboard Designer • Back to DD • Select Create tab • Select Dashboard • Select Dashboard Page Template • Select ‘OK’
Dashboard Designer Resources available in workspace Dashboard editing & layout Content available in current dashboard
Dashboard Designer • Click on Sharepoint tab • Click on PP Content • Double click on ‘Graph’
Dashboard Designer • Graph has opened in workspace
Dashboard Designer • Click on New Dashboard 4 • Note Graph added on left • Expand Reports in right • Note Graph added • Drag & drop Graph into Bottom Row of Dashboard • Save
Dashboard Designer • Right click on New Dashboard • Select Deploy to SharePoint • Select Dashboards • Select ‘OK’
Dashboard Designer • Your dashboard is displayed
Dashboard Designer • Click on Dashboards • New dashboard is shown • Dashboard can be run form here now
SQL Server Reporting Services • Open link to SQL Server Reporting Services • http://edss-dev-pc/Reports/Pages/Folder.aspx • Click on Report Builder • Select the Table or Matrix Wizard
SQL Server Reporting Services • Select Create a dataset • Select Next • Select New to create a new Data Source Connection
SQL Server Reporting Services Give the Data Source a name Select ‘Microsoft SL Server Analysis Services as the Connection Type when using our test cubes Select Build Add ‘EDSS-DEV-PC’ as the Server Name Select the database that houses the cube you want to work with 1 2 3 4 5 • Select OK, OK, Next