Download
1 / 21
210 likes | 349 Views
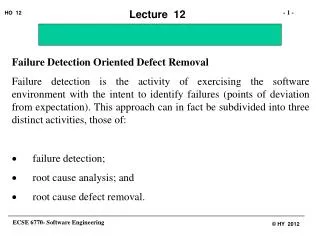
Defect Removal Metrics. Defect Removal Metrics: Concepts. All defect removal metrics computed from the measurements identified last time: Inspection reports, test reports, field defect reports. Used to get different views on what’s going on.

E N D
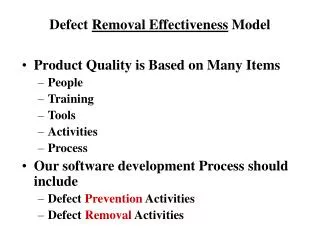
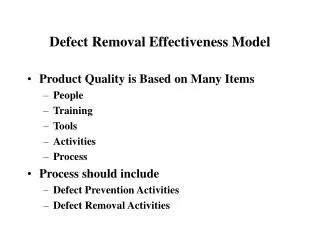
Defect Removal Metrics: Concepts • All defect removal metrics computed from the measurements identified last time: • Inspection reports, test reports, field defect reports. • Used to get different views on what’s going on. • Each metric can be used to tell us something about the development process or results. • Many are amazingly useful, though all have limitations. • Need to learn how to use each tool effectively. • For most defect metrics, filter out minor and cosmetic defects. • Can easily make many metrics look good by finding more or fewer cosmetic problems (level of nitpicking).
Measuring “Total Number of Defects” • Many metrics have parameters such as “total number of defects” e.g. total number of requirements defects. • Clearly, we only ever know about the defects that are found. • So we never know the “true” value of many of these metrics. • Further, as we find more defects, this number will increase: • Hopefully, finding defects is asymptotic over time i.e. we find fewer defects as time goes along, especially after release. • So metrics that require “total defects” type info will change over time, but hopefully converge eventually. • The later in the lifecycle we compute the metric, the more meaningful the results. • If and when we use these metrics, we must be aware of this effect and account for it.
Measuring Size • Many defect metrics have “size” parameters: • The most common size metric is KLOC (thousands of lines of code). • Depends heavily on language, coding style, competence. • Code generators may produce lots of code, distort measures. • Does not take “complexity” of application into account. • Easy to compute automatically and “reliably” (but can be manipulated). • An alternative size metric is “function points” (FP’s). • A partly-subjective measure of functionality delivered. • Directly measures functionality of application: number of inputs and outputs, files manipulated, interfaces provided etc. • More valid but less reliable, more effort to gather. • We use KLOC in our examples, but works just as well with FP’s.
Defect Density • Number of defects / size. • Defect density in released code (“defect density at release”) is a good measure of organizational capability. • Defects found after release / size of released software. • Can compute phasewise and component-wise defect densities. • Useful to identify “problem” components that could use rework or deeper review. • Note that problem components will typically be high-complexity code at the heart of systems. • Defect densities (and most other metrics) vary a lot by domain. • Can only compare across similar projects.
Using Defect Density • Very useful as measure of organizational capability to produce defect-free outputs. • Can be compared with other organizations in the same domain. • Outlier information useful to spot problem projects and problem components. • Can be used in-process, if comparison is with defect densities of other projects in same phase. • If much lower, may indicate defects not being found. • If much higher, may indicate poor quality of work. • (In other words, need to go behind the numbers to find out what is really happening. Metrics can only provide triggers)
Defect Density: Limitations • Size estimation itself has problems. • “Total Defects” problem. • Criticality and criticality assignment. • Combining defects of different criticalities reduces validity. • Criticality assignment is itself subjective. • Defects may not equal reliability. (User experience problem). • Statistical significance when applied to phases and components. • Actual number of defects may be so small that random variation can mask significant variation.
Defect Removal Effectiveness • Percentage of defects removed during a phase. • (Defects found) / (Defects found during that phase + Defects not found). • Approximated by: • (Defects found) / (Defects found during that phase + Defects found later). • Includes defects carried over from previous phases. • Good measure of effectiveness of defect removal practices. • Test effectiveness, inspection effectiveness. • Correlates strongly with output quality. • Other terms: Defect removal efficiency, error detection efficiency, fault containment etc.
DRE Table Example Phase of Origin Phase Found Phase Found Phase of Origin (Illustrative example, not real data)
DRE Value • Compute effectiveness of tests and reviews: • Actual defects found / defects present at entry to review/test. • (Phasewise Defect Removal Efficiency: PDRE) • Compute overall defect removal efficiency: • Problems fixed before release / total originated problems. • Analyze cost effectiveness of tests vs. reviews: • Hours spent per problem found in reviews vs. tests. • Need to factor in effort to fix problem found during review vs. effort to fix problem found during test. • To be more exact, we must use a defect removal model. • Shows pattern of defect removal. • Where defects originate (“injected”), where they get removed.
DRE Implications • Counter- intuitive implication. • If testing reveals lots of bugs, likely that final product will be very buggy too. • Not true that “we have found and fixed a lot of problems, now our software is OK”. • We can only make this second assertion if testing reveals lots of bugs early on, but the latter stages of testing reveal hardly any bugs – and even then, only if you are not simply repeating the same tests!
DRE Limitations • Statistical significance: • Note how small the numbers in each box are. • Hard to draw conclusions from data about 1 project. • At best a crude indicator of which phases & reviews worked better. • Organizational data has far more validity. • Remember that when the numbers are small, better to show the raw numbers. • Even if you showing DRE percentages, include actual defects data in each box. • Full picture only after project completion. • Easily influenced by underreporting of problems found.
Other Related Metrics • Phase Containment Effectiveness: • % of problems introduced during a phase that were found within that phase. • E.g. Table 1 design PCE = 14/38 = 0.37 ( 37%) • PCE of 70% is considered very good. • Phasewise Defect Injection Rate: • Number of defects introduced during that phase / size. • High injection rates (across multiple projects) indicate need to improve the way that phase is performed. • Possible solutions: training, stronger processes, checklists.
Defect Removal Model (From Kan Text) Defects remaining after phase exit Defects injected during development Undetected defects Defect detection Defects existing on phase entry • Can predict defects remaining, given: • Historical data for phasewise defect injection rates. • Historical data for rates of defect removal. • Historical data for rates of incorrect fixes. • Actual phasewise defects found. • Can statistically optimize defect removal, given (in addition to rates). • Phasewise costs of fixing defects. • Phasewise costs of finding defects (through reviews and testing). • Can decide whether it is worthwhile to improve fault injection rates, by providing additional training, adding more processes & checklists etc. Incorrect fixes Defect fixing Defects removed This is “statistical process control”. But remember all the disclaimers on its validity.
Additional Metrics for Inspections • Several simple (secondary) metrics can be tracked and managed within control limits: • Inspection rates: • Size / Duration of inspection meeting. • Very high or very low rates may indicate problem. • Inspection effort: • Preparation + meeting + tracking / size • Inspection preparation time: • Avoid overloading others on team, make sure preparation happens. • Inspection effectiveness is still the bottom line. • These are just helping with optimizing inspections.
Cost of Quality (COQ) • Total effort put into quality-related activities: • Testing and test development effort. • Inspections and reviews. • Quality assessments and preparation. • COQ is a percentage of project effort. • Pure number, suitable for comparisons across projects, organizations. • Can observe relationships between COQ and defect removal efficiency, COQ and release defect density. • Note that defect prevention reverses the normal relationships: reduces both COQ and release defect density. • Will NOT show up in defect removal effectiveness!
Cost of Poor Quality (COPQ) • Total effort put into rework: • Cost of fixing defects • Cost of revising/updating docs • Cost of re-testing, re-inspecting • Cost of patches & patch distribution, tracking defects • Percentage of project effort, a pure number. • Would generally correlate well with defect densities. • If there are fewer defects, less rework needed. • COPQ < 10% is very good. • Note that early defect detection (inspections) reduces COPQ.
Optimizing Quality Efforts • Normally, there is a balance between COQ and COPQ. • To reduce rework, need to spend more effort on quality upfront. • Note that high COPQ increases COQ, because of re-testing. • Defect prevention and superior quality approaches (better test methodologies, more effective reviews) cut both COQ and COPQ. • Objective is to have a lower COQ while maintaining good (low) COPQ and low release defect density. • More quality efforts will always improve quality, but there is a point of diminishing returns. • COPQ, release defect density within targets -> adequate quality.
Limitations of COQ/COPQ • Assumes the numbers are accurate. • That they fairly reflect all defect removal activities and all rework activities. • COPQ easily distorted if there is one requirements or design bug that creates a large amount of rework. • Balancing COQ / COPQ is an organizational-level activity. • Improves statistical significance, averages out variations. • Evens out distortions in COPQ due to a couple of high-rework bugs. • Need to wait till product has been in the field to get “truer” COPQ numbers.
Limitations of COQ/COPQ - Cont’d • Can Use COQ / COPQ at the project level as indicators. • But need to go behind the numbers to interpret better. • Hard for COQ to account properly for unit tests if developers do it along with coding. • Inspections often have additional hidden effort because developers will go through their code extra carefully before submitting it for inspection.
Summary • Need multiple stages of defect removal: • Inspections are well-known to be cost-effective. • Early detection of defects saves work. • More expensive to fix bugs late in lifecycle. • Release defect densities tell us about the quality of the product. • DRE chart helps us to: • Compute inspection and test effectiveness. • Predict field defect rates. • See pattern of defect removal. • Defect removal metrics can also help optimize effort spent on quality activities. • Notice how all these fancy metrics come from just the basic review and test reports! Don’t gather lots of data, focus on meaningful analysis.