Download
1 / 6
60 likes | 163 Views
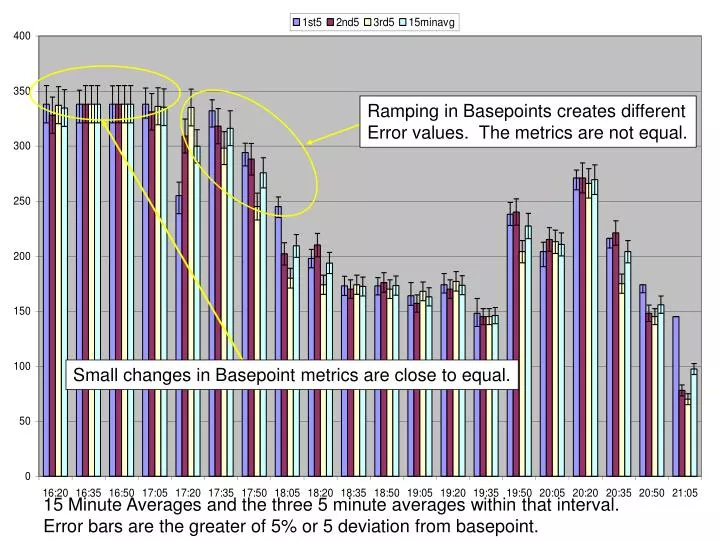
Ramping in Basepoints creates different Error values. The metrics are not equal. Small changes in Basepoint metrics are close to equal. 15 Minute Averages and the three 5 minute averages within that interval. Error bars are the greater of 5% or 5 deviation from basepoint.

E N D
Ramping in Basepoints creates different Error values. The metrics are not equal. Small changes in Basepoint metrics are close to equal. 15 Minute Averages and the three 5 minute averages within that interval. Error bars are the greater of 5% or 5 deviation from basepoint.