Download
1 / 22
220 likes | 234 Views
WAN Network Performance. More than Bandwidth. Optimizing WIDE Area Transfer. Network Factors Parameters of network impacting transfer rates Node Factors Machine configurations impacting transfer rates Measurement and Test Using perfsonar nodes to examine performance across the network.

E N D
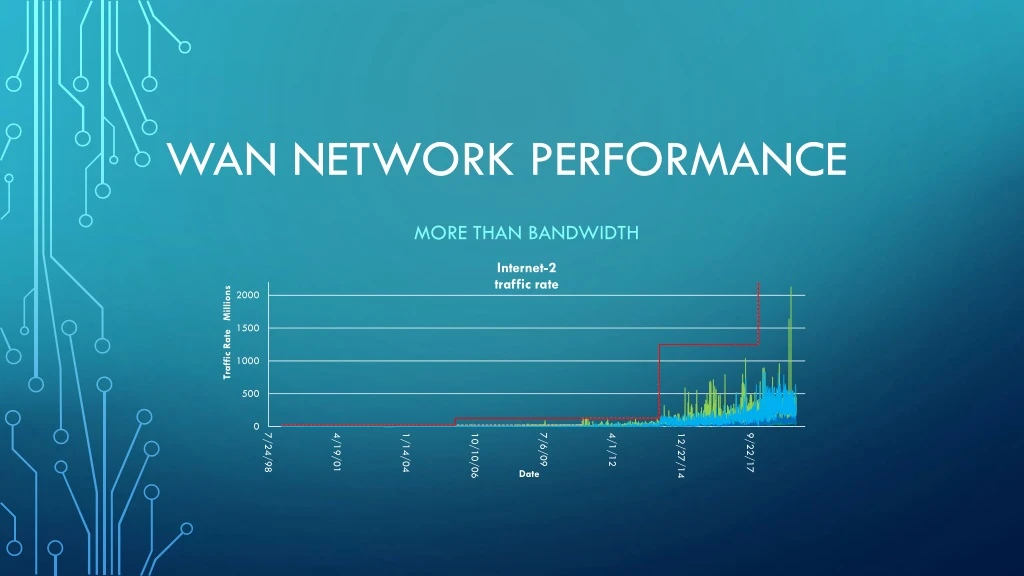
WAN Network Performance More than Bandwidth
Optimizing WIDE Area Transfer • Network Factors • Parameters of network impacting transfer rates • Node Factors • Machine configurations impacting transfer rates • Measurement and Test • Using perfsonar nodes to examine performance across the network
Network Parameters Bandwidth, Delay and Loss Main factors effect network stream performance (single TCP connection) • Bandwidth – available “data speed” of connection • Connectivity – link speeds throughout the path 1 Gbps, 10 Gbps, 40 Gbps, 100 Gbps • Delay – Round Trip Time (RTT) • Delay between sending and receiving – speed of light • Store and Forward “Hops” • Loss – packet loss • Path Bandwidth – Various link speeds in path • Network Congestion – traffic contending for the same link(s)
Path Bandwidth Path bandwidth – available speeds end-to-end System Network attachment Campus Network Wide-Area Network(s) Cornell campus and WAN Local connection speeds Building Connection – To Building: 10G, building internals: 1/10G, CAC: 100G Backbone Connection - 2019: 100G (x2) to Rhodes, 10G (x2) to other nodes 100G Cornell to NYSERNet 100G NYSERNet and Internet2 backbones 1/10/100G Internet2 to participating institutions Mushy Details – may vary over time Multi-path routes - multiple paths across an area Network equipment internals – backplane forwarding; flow processing in firewalls; buffer overflows Contending traffic – other traffic along the paths
Packet Loss – a network property Internet is design to be • Packeted – traffic is broken in to packets (1500 or 9000 Bytes) • Lossy – data can be lost, resulting in lost packets • Link(s) capacity • Traffic contending for output on a link • Traffic “over spilling” buffers – in/out on network devices • Loss is recovered within TCP protocol – signaling protocol to retransmit lost data • In-the-kernel – Applications are unaware of details, only the throughput • ‘netstat -s’ reports box-level retransmits, but per-connection is not generally available.
TCP Packet Loss TCP: Loss-less protocol for lossy networks Lost packets – nominal method of detecting that you’ve exceeded the “network” Retransmission – TCP Congestion Windows (CWND), Selective Acknowledgement (SACK) Congestion Avoidance – “Slow Start” pacing upon packet loss. Congestion avoidance –https://en.wikipedia.org/wiki/TCP_congestion_control Equipment Buffers – can help / can hurt
TCP actions Interval Throughput Retransmits Current Window 0.0 - 1.0 7.19 Mbps 1 40.54 KBytes 1.0 - 2.0 17.62 Mbps 0 94.12 KBytes 2.0 - 3.0 45.87 Mbps 0 238.92 KBytes 3.0 - 4.0 91.23 Mbps 0 457.57 KBytes 4.0 - 5.0 166.83 Mbps 0 847.08 KBytes 5.0 - 6.0 251.66 Mbps 1 1.04 MBytes 6.0 - 7.0 304.09 Mbps 0 1.46 MBytes 7.0 - 8.0 482.35 Mbps 0 2.21 MBytes 8.0 - 9.0 702.55 Mbps 0 3.14 MBytes 9.0 - 10.0 964.69 Mbps 1 2.14 MBytes 10.0 - 11.0 555.74 Mbps 0 2.18 MBytes 11.0 - 12.0 555.74 Mbps 0 2.25 MBytes 12.0 - 13.0 356.51 Mbps 1 1.17 MBytes 13.0 - 14.0 304.09 Mbps 0 1.22 MBytes 14.0 - 15.0 314.57 Mbps 0 1.37 MBytes 15.0 - 16.0 377.49 Mbps 0 1.66 MBytes 16.0 - 17.0 314.57 Mbps 1 926.72 KBytes 17.0 - 18.0 146.80 Mbps 1 501.01 KBytes 18.0 - 19.0 125.83 Mbps 0 548.79 KBytes 19.0 - 20.0 157.29 Mbps 0 693.59 KBytes Summary Interval Throughput Retransmits 0.0 - 20.0 312.13 Mbps 6 Sample iperf3 stream to: perfsonar1.ccast.ndsu.edu The RRT is: 31 msec The Node Connectivity: 10G
Latency - A network property Bandwidth*delay product Tuning Improvements Delay is the time between sending and receiving often express as Round Trip Time (RTT) TCP Windows – Computed during setup. How much to keep sending while awaiting acknowledgement for what has been sent already. Congestion Window (cwnd) used recover lost packets Long RRT and high bandwidth – these increase the amount of “unacknowledged” packets/bytes. TCP window scaling – RFC1323 TCP windows can be bigger than 16-bit value Check support for RFC1323 Selective Acknowledgement (SACK) Host can re-transmit a single lost packet, or a whole TCP window. Check Support RFC2018 Host tuning can improve stream performance Many hosts tuned for 100M-1G Increase network buffers - https://fasterdata.es.net/ Kernel TCP queue and CA algoshttp://man7.org/linux/man-pages/man8/tc.8.html Kernel testing, simulation https://wiki.linuxfoundation.org/networking/netem
Packet Loss and Latency campus Sydney AU 221 msec metro FERMI Lab 35 msec NYC 8 msec Stanford 73 msec Cern.ch 91 msec AWS east 16 msec
Host Transfer Performance • Distance/Latency • If local transfer: high transfer rates with no special consideration • If Wide-Area transfer: host tuning to improve stream performance • Host bus and disk performance • PCIe host bus improvement: PCIeV3 has +10G channels • Memory speed: 64-bit, SSD RAM • Disk speed: NVMe, SATA, RPMs • https://en.wikipedia.org/wiki/PCI_Express • Protocols • Single-stream transfers: scp, sftp • TCP vs UDP • Multistream: gridFTP, Globus, Apsera, bbcp
Storage Speeds Performance of Storage Technologies Traditional 7200 RPM HDD: 160 MB/s SATA III SSD: 600 MB/s NVME M.2 SSD: 3500 MB/s
Host Configurations Latency Hardware Protocol Increase host network buffers Window Scaling support (RFC1323) SACK support (RFC2018) Congestion Avoidance algorithm https://fasterdata.es.net/ 10/40/100G Ethernet PCIe buss speeds Memory performance Disk speed, disk attachment, I/O https://en.wikipedia.org/wiki/PCI_Express https://fasterdata.es.net/science-dmz/DTN/hardware-selection/ Transports TCP vs UDP Single-stream vs multi-stream Applications and Tools GridFTP, Globus, Aspera Scp/sftp, bbcp http://moo.nac.uci.edu/~hjm/HOWTO_move_data.html
perfsonar So data transfers are slow… Wouldn’t it be nice to test the network with machine(s) along the network path to benchmark the path, latency, and peak transfer-rates Solution: Perfsonar nodes • Publicly accessible resource placed in campuses, labs, research sites around the world • Owamp ping to measure latency • traceroutes/tracepath to identify path from remote location • iperf3, iperf2, nuttcpdata-rate transfers tests between other perfsonar nodes • Mechanisms to execute tests from other, remote perfsonar nodes • Ad-hoc and schedulable test execution
Cornell Campus Perfsonar TESTERs Two 10GE testers Border, located adjacent to 100GE WAN router: http://ps-wan-10g.net.cornell.edu/ CAC, located adjacent to CAC/Rhodes 100GE router: http://ps-rhodes-10g.net.cornell.edu/
Perfsonar Ad-hocinvestigate path characteristics Latency to Sites Throughput to Sites
Perfsonar pschedulerrun tests routinely to observer over timeRUN TEST BETWEEN ANY Two PERFSONAR NODES
[ps-rhodes-10g ~]$ pscheduler task throughput --dest perfsonar1.ccast.ndsu.edu --source perf-master.nysernet.org Submitting task... Task URL: https://perf-master.nysernet.org/pscheduler/tasks/b0f9ce1f-4bf8-4bed-8d5a-1595bdd4b3b6 Running with tool 'iperf3' Fetching first run... Next scheduled run: https://perf-master.nysernet.org/pscheduler/tasks/b0f9ce1f-4bf8-4bed-8d5a-1595bdd4b3b6/runs/6431eead-d5eb-442b-b685-c1f76c8a26c1 Starts 2019-07-25T14:19:13Z (~51 seconds) Ends 2019-07-25T14:19:32Z (~18 seconds) Waiting for result... * Stream ID 5 Interval Throughput Retransmits Current Window 0.0 - 1.0 5.91 Mbps 1 36.20 KBytes 1.0 - 2.0 18.21 Mbps 0 88.33 KBytes 2.0 - 3.0 43.27 Mbps 0 228.78 KBytes 3.0 - 4.0 94.36 Mbps 0 453.22 KBytes 4.0 - 5.0 176.14 Mbps 0 832.60 KBytes 5.0 - 6.0 283.12 Mbps 0 1.25 MBytes 6.0 - 7.0 429.93 Mbps 0 1.88 MBytes 7.0 - 8.0 304.08 Mbps 2 1.02 MBytes 8.0 - 9.0 272.60 Mbps 0 1.08 MBytes 9.0 - 10.0 304.13 Mbps 0 1.25 MBytes Summary Interval Throughput Retransmits 0.0 - 10.0 193.17 Mbps 3 No further runs scheduled. Between ANY NODEs Example of throughput test Source: perf-master.nysernet.org Destination: perfsonar1.ccast.ndsu.edu
Test from you machine to Perfsonarsee On-Demand Testing tools Tracepath to wah-pt1.es.net Ping, traceroutes, tracepath