Download

1 / 58
580 likes | 675 Views
The End of America. The Only Freedom Is Freedom from Illusion… Stefan Molyneux, MA Host, Freedomain Radio www.freedomainradio.com. We are generally told that there was an unfortunate recession, and that a recovery is underway. This is unfortunately not true.

E N D
The End of America The Only Freedom Is Freedom from Illusion… Stefan Molyneux, MA Host, Freedomain Radio www.freedomainradio.com
We are generally told that there was an unfortunate recession, and that a recovery is underway. • This is unfortunately not true. • The multi-decade orgy of coercion and deception is almost over. • And we know it. Introduction
TSA • People who hate the Olympics • The Most Disliked Company In America • Abortion • Nixon • Banks and Financial Institutions • Paris Hilton • Socialism Things Americans like Better Than Their Lawmaking Body
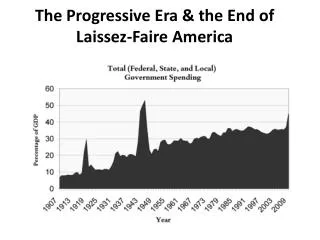
This Cuts Into Federal Spending on Everything Else (infrastructure)
In the 1950s, 85% of all working age men had a job; below 65% now
Reclassification of unemployed • Failure to distinguish between public and private sector • Ignoring debt Economic Number Manipulation
According to the US Department of labor, 163,000 new jobs created in July 2012. • Reality is that the US lost over 1.2 million jobs that month. • In the 5 months since June, 847,000 jobs created. • 73% of them are government jobs. • To keep up with population growth, 150,000 new jobs needed a month. • Not counting governments jobs, 500,000 deficit. • Since January 2009, the "labor force" in the United States has increased by 827,000, but "those not in the labor force" has increased by 8,208,000. • Barack Obama has been president for less than four years, and during that time the number of Americans "not in the labor force" has increased by nearly 8.5 million. Reclassification of Unemployed
The US lost 9 million private sector jobs during the Great Recession. • Since job growth resumed, 5 million private sector jobs have been created. • The level of private sector jobs remains 13 million below the pre-crisis trend. The Jobs Gap Is Not Closing
Unemployment tends to drop because people leave the workforce. • Almost 550,000 Americans leave the labor force in any given month. • Since Jan 2009, 194,000 new jobs created. • 14.7 million people added to the food stamp rolls. • When Barack Obama first took office, "long-term unemployed workers" in the United States: 2.6m. • Today, that number is sitting at 5.6 million. • There are about 88 million working age Americans that are not employed and not looking for employment. • The percentage of working age Americans with a job has been under 59% for 39 months in a row Giving up Looking for Work
In 2000, about 20% of all jobs in America were manufacturing jobs. Today, about 5% of all jobs in America are manufacturing jobs. • 60% of the jobs lost during the last recession were mid-wage jobs, but 58% of the jobs created since then have been low wage jobs. • The U.S. economy lost more than 220,000 small businesses during the recent recession. • In 2010, the number of jobs created at new businesses in the United States was less than half of what it was in 2000. • America is losing half a million jobs to China every single year. Drop In Work Quality
The United States has lost an average of approximately 50,000 manufacturing jobs a month since China joined the World Trade Organization in 2001. • More than 56,000 manufacturing facilities in the United States have been shut down since 2001. • ~20% of all U.S. adults are currently working jobs that pay poverty-level wages. • More than 40% of Americans who actually are employed are now working in service jobs, which are often very low paying. • At this point, less than 25% of all jobs in the United States are "good jobs", and that number continues to shrink. • 55% of all small business owners in America "say they would not start a business today given what they know now and in the current environment." Death of Manufacturing
In the United States today, more than 41% of all working age Americans are not working. • If you gathered together all of the workers that are "officially" unemployed in the United States into one nation, they would constitute the 68th largest country in the entire world. The End of Employment
Total compensation costs for management, professional, and related occupations, which represent approximately half of all state and local government employment, averaged $50.43 per hour worked. • State and local government employers spent an average of $41.56 per hour worked for employee compensation in September 2012. • Total employer compensation costs for private industry workers averaged $28.95 per hour worked in September 2012. • In the United States, the average federal worker now earns 60% MORE than the average worker in the private sector. • In 2006, only 12% of all federal workers made $100,000 or more per year. Now, approximately 22% of all federal workers do. • U.S. public pensions are $4.6 trillion short of the amount of assets needed to cover projected liabilities. The Public Sector
The U.S. share of global GDP has fallen from 31.8% in 2001 to 21.6% in 2011. • 61% of all Americans were "middle income" back in 1971. Today, only 51% of all Americans are. • Back in 1950, more than 80% of all men in the United States had jobs. Today, less than 65% of all men in the United States have jobs. • ~One out of every four American workers makes 10 dollars an hour or less. Dropped
Payroll change since January 2008 • Total: -5.01 million -3.6% • Private: -4.61 million -4% • Government: -407,000 -1.8% • Federal Government: (excluding post office) +225,000 11.4% From July 2012
77% of all Americans are living to paycheck to paycheck at least some of the time. • Median household income in America has fallen for four consecutive years. Overall, it has declined by over $4,000 during that time span. • 36% of Americans say that they don’t contribute anything to retirement savings. • 24% of American workers say that they have postponed their planned retirement age in the past year. • 43% of Americans have less than $10,000 saved up for retirement. • 28% of all Americans do not have a single penny saved for emergencies. The End of the Middle Class
In the United States today, somewhere around 100 million Americans are considered to be either “poor” or “near poor.” • Back in 2007, 19.2% of all American families had a net worth of zero or less than zero. By 2010, that figure had soared to 32.5%. • 40% of all Americans have $500 or less in savings. • ~10 million households do not have a single bank account. • United States actually has a higher percentage of workers doing low wage work than any other major industrialized nation does. • In 2010, 2.6 million more Americans fell into poverty. That was the largest increase that we have seen since the U.S. government began keeping statistics on this back in 1959. The Rise of Poverty
There are now 20.2 million Americans that spend more than half of their incomes on housing. That represents a 46% increase from 2001. • only 51% of all Americans that are at least 18 years old are currently married. Back in 1960, 72% of all U.S. adults were married. • In 1984, the median net worth of households led by someone 65 or older was 10 times larger than the median net worth of households led by someone 35 or younger. • Today, the median net worth of households led by someone 65 or older is 47 times larger than the median net worth of households led by someone 35 or younger. The End of Income and Marriage
Total consumer debt in the United States has risen by 1700% since 1971. • In 1983, the bottom 95% of all income earners had 62 cents of debt for every dollar that they earned. By 2007, that figure had soared to $1.48 • ~One-third of all Americans are not paying their bills on time. • 43% of all American families spend more than they earn each year. • After adjusting for inflation, U.S. college students are borrowing about twice as much money as they did a decade ago. • 46% of all Americans carry a credit card balance from month to month. The Growth of Debt
Of the U.S. households that do have credit card debt, the average amount of credit card debt is an astounding $15,799. • Overall, Americans are carrying a grand total of $798 billion in credit card debt. If you were alive when Jesus was born and you spent a million dollars every single day since then, you still would not have spent $798 billion by now. • 45% of all auto loans are made to subprime borrowers. • The ratio of household debt to personal income in the United States is now 154%. Death by Credit
83% of all U.S. stocks are in the hands of 1% of the people. • 66% of the income growth between 2001 and 2007 went to the top 1% of all Americans. • Only the top 5% of U.S. households have earned enough additional income to match the rise in housing costs since 1975. • For the first time in U.S. history, banks own a greater share of residential housing net worth in the United States than all individual Americans put together. • The bottom 50% of income earners in the United States now collectively own less than 1% of the national wealth. • In the United States today, corporate profits are at an all-time high. The percentage of Americans that are living in "extreme poverty" is also at an all-time high according to the U.S. Census Bureau. The Cancer of Inequality
More than 100 million Americans are enrolled in at least one welfare program run by the federal government. (And that does not even count Social Security or Medicare.) • Back in the 1970s, about one out of every 50 Americans was on food stamps. Today, about one out of every 6.5 Americans is on food stamps. • Approximately one-fourth of all children in the United States are enrolled in the food stamp program. • 21% of all children in the US are living below the poverty line in 2010 – the highest rate in 20 years. • Median household income for families with children dropped by $6,300 between 2001 and 2011. • Half of all American children will be on food stamps at least once before they turn 18 years of age. Poverty Levels
The number of Americans living in poverty has increased by about 6 million over the past four years. • About one out of every four workers in the United States brings home wages that are at or below the federal poverty level. • ~57% of all children in the United States are living in homes that are either considered to be either "low income" or impoverished. • The number of children living in poverty in the state of California has increased by 30% since 2007. • In the city of Detroit today, more than 50% of all children are living in poverty, and close to 50% of all adults are functionally illiterate. Broke
49% of all Americans live in a home where at least one person receives financial assistance from the federal government. • In 1983, that number was < 30%. • The number of Americans living in poverty rose to a new all-time record of 49.7 million. • During 2011, 53% of all Americans with a bachelor's degree under the age of 25 were either unemployed or underemployed. • 85% of all college seniors plan on moving back in with their parents after graduation. Dependent
Real inflation rate estimated at 10% per year. • Half the value of your money in 7 years. • On average, you could buy about 10 gallons of gas for an hour of work back in the mid-90s. Today, the average hour of work will get you less than 6 gallons of gas. • To get the same purchasing power that you got out of $20.00 back in 1970 you would have to have more than $116 today. • A central reason why savings are so low. Inflation
During 2012, the U.S. government had to roll over nearly 3 trillion dollars of old debt. • The U.S. national debt is now more than 22 times larger than it was when Jimmy Carter became president. • During the Obama administration, the U.S. government has accumulated more debt than it did from the time that George Washington took office to the time that Bill Clinton took office. • If the federal government began right at this moment to repay the U.S. national debt at a rate of one dollar per second, it would take over 440,000 years to pay off the national debt. Government Debt(i.e. your children’s debt)
If Bill Gates gave every single penny of his fortune to the U.S. government, it would only cover the U.S. budget deficit for about 15 days. • Right now, the U.S. national debt is increasing by about 150 million dollars every single hour. • During fiscal year 2012, 62% of the federal budget was spent on entitlements. • Back in 1965, only one out of every 50 Americans was on Medicaid. Today, approximately one out of every 6 Americans is on Medicaid. Impossible to Repay
The condition of the U.S. economy today mirrors the economic situation prior to the Great Depression. • Slow economic growth, massive deficits, high unemployment and foreclosures, and a shaky banking system. • Real unemployment is at the same level it was during the Great Depression, around 25%. • The drop in home prices and sales is actually worse than during the Great Depression. • The stock market has been dropping, and stocks are currently overvalued by as much as 50%. • Youth unemployment in the United States is now at the highest level that we have seen since World War II. The Greatest Depression
The Great Depression had NONE of the structural, economic, and social problems, nor the massive obligations. • In 1929 America was not $16 trillion in debt, plus facing over $100 trillion in unfunded liabilities. That’s over $360,000 in debt per citizen. • In 1929, most of our states were not bankrupt, insolvent and dependent on federal government handouts to survive. One county (Cook County which includes Chicago, Illinois) now owes over $108 billion in debt (the biggest part of it in unfunded government employee pensions). • In 1929, we did not have 21 million government employees with bloated salaries, obscene pensions, and free health care for life. Today 1 out of 5 federal employees earn over $100,000. • In 1929, Social Security, Medicare, and Medicaid didn’t exist. The federal government had no such obligations threatening to consume the entire federal budget within a few years. Tragic Indicators