Download
1 / 1

E N D
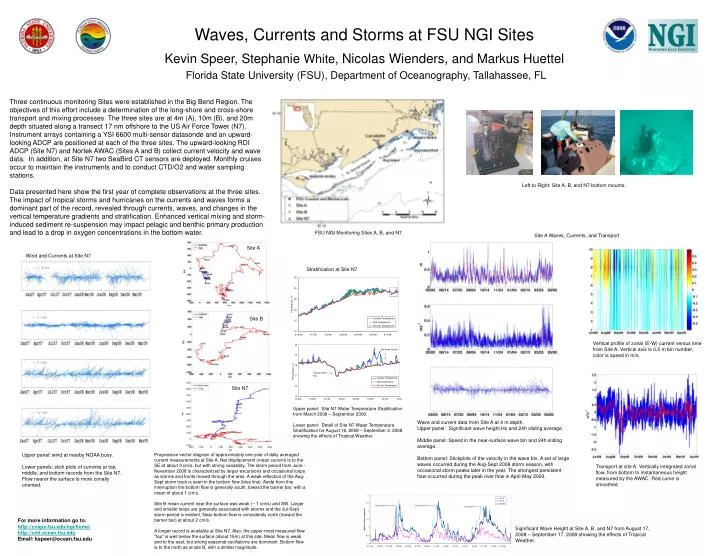
Three continuous monitoring Sites were established in the Big Bend Region. The objectives of this effort include a determination of the long-shore and cross-shore transport and mixing processes. The three sites are at 4m (A), 10m (B), and 20m depth situated along a transect 17 nm offshore to the US Air Force Tower (N7). Instrument arrays containing a YSI 6600 multi-sensor datasonde and an upward-looking ADCP are positioned at each of the three sites. The upward-looking RDI ADCP (Site N7) and Nortek AWAC (Sites A and B) collect current velocity and wave data. In addition, at Site N7 two SeaBird CT sensors are deployed. Monthly cruises occur to maintain the instruments and to conduct CTD/O2 and water sampling stations. Data presented here show the first year of complete observations at the three sites. The impact of tropical storms and hurricanes on the currents and waves forms a dominant part of the record, revealed through currents, waves, and changes in the vertical temperature gradients and stratification. Enhanced vertical mixing and storm-induced sediment re-suspension may impact pelagic and benthic primary production and lead to a drop in oxygen concentrations in the bottom water. Waves, Currents and Storms at FSU NGI SitesKevin Speer, Stephanie White,Nicolas Wienders, and Markus HuettelFlorida State University (FSU), Department of Oceanography, Tallahassee, FL Left to Right: Site A, B, and N7 bottom mounts. FSU NGI Monitoring Sites A, B, and N7. Site A Waves, Currents, and Transport Site A Wind and Currents at Site N7 Stratification at Site N7 Site B Vertical profile of zonal (E-W) current versus time from Site A. Vertical axis is 0.5 m bin number, color is speed in m/s. Site N7 Upper panel: Site N7 Water Temperature Stratification from March 2008 – September 2008. Lower panel: Detail of Site N7 Water Temperature Stratification for August 16, 2008 – September 3, 2008 showing the effects of Tropical Weather. Wave and current data from Site A at 4 m depth. Upper panel: Significant wave height Hs and 24h sliding average. Middle panel: Speed in the near-surface wave bin and 24h sliding average. Bottom panel: Stickplots of the velocity in the wave bin. A set of large waves occurred during the Aug-Sept 2008 storm season, with occasional storm peaks later in the year. The strongest persistent flow occurred during the peak river flow in April-May 2009. Progressive vector diagram of approximately one year of daily averaged current measurements at Site A. Net displacement (mean current) is to the SE at about 3 cm/s, but with strong variability. The storm period from June - November 2008 is characterized by larger excursions and occasional loops as storms and fronts moved through the area. A weak reflection of the Aug-Sept storm track is seen in the bottom flow (blue line). Aside from this interruption the bottom flow is generally south, toward the barrier bar, with a mean of about 1 cm/s. Site B mean current near the surface was weak (~ 1 cm/s) and SW. Larger and smaller loops are generally associated with storms and the Jul-Sept storm period is evident. Near-bottom flow is consistently north (toward the barrier bar) at about 2 cm/s. A longer record is available at Site N7. Also, the upper-most measured flow "top" is well below the surface (about 15m) at this site. Mean flow is weak and to the east, but strong seasonal oscillations are dominant. Bottom flow is to the north as at site B, with a similar magnitude. Upper panel: wind at nearby NOAA buoy. Lower panels: stick plots of currents at top, middle, and bottom records from the Site N7. Flow nearer the surface is more zonally oriented. Transport at site A. Vertically integrated zonal flow, from bottom to instantaneous height measured by the AWAC. Red curve is smoothed. For more information go to: http://coaps.fsu.edu/ngi/home/ http://cmf.ocean.fsu.edu Email: kspeer@ocean.fsu.edu Significant Wave Height at Site A, B, and N7 from August 17, 2008 – September 17, 2008 showing the effects of Tropical Weather.