Download
1 / 5
50 likes | 121 Views

E N D
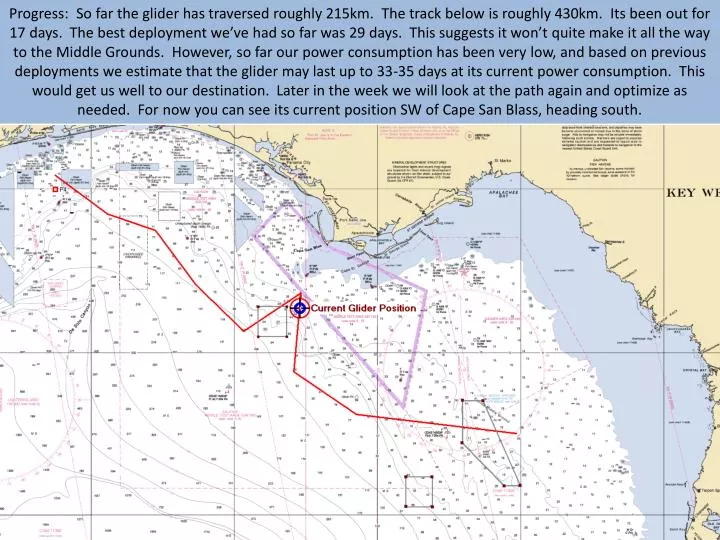
Progress: So far the glider has traversed roughly 215km. The track below is roughly 430km. Its been out for 17 days. The best deployment we’ve had so far was 29 days. This suggests it won’t quite make it all the way to the Middle Grounds. However, so far our power consumption has been very low, and based on previous deployments we estimate that the glider may last up to 33-35 days at its current power consumption. This would get us well to our destination. Later in the week we will look at the path again and optimize as needed. For now you can see its current position SW of Cape San Blass, heading south.
Current track over 7 day chlorophyll image (04/02/12) from Hu’s Optical Oceanography Lab site.
Temperature, Salinity, And Density plots so far. Note the rain events on March 20th and April 1st corresponding to front passages. The transect across the shelf toward Cape San Blas starts on March 29th.
Chlorophyll, CDOM, backscatter, and oxygen plots so far. Data is more sparse than in the CTD data due to a scaling back in the amount of data transmitted to minimize time on the surface (i.e. not transiting). Backscatter is typically the first to show biofouling and may be beginning to show such , or it could just be that the glider is closer to shore.