Download
1 / 46
460 likes | 601 Views
Northumberland. Presentation of the Residents’ Survey 2012. December 2012 12-035607-01. What we will cover today… The impact of the economy on residents What residents think of their local area Residents involvement in their local area What they think of the council and its services

E N D
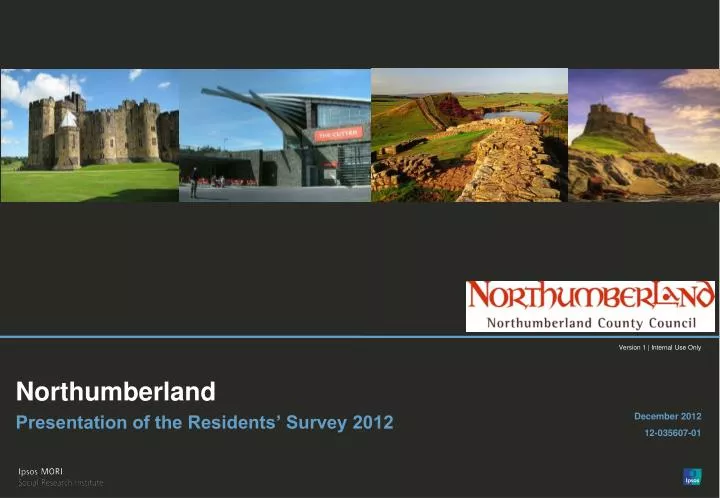
Northumberland Presentation of the Residents’ Survey 2012 December 2012 12-035607-01
What we will cover today… The impact of the economy on residents What residents think of their local area Residents involvement in their local area What they think of the council and its services Residents health & well being • Drilling down into the data… • Small area level • Trend analysis - 2008 Place survey • -Compare to the Consortium
Introduction • The survey was commissioned by the North East Consortium. To enable benchmarking of results across the seven Councils involved, eight pages of questions were common to all. • The questions were drawn from the Place Survey and from benchmarking questions recommended by the LGA from the ‘Are you being served?’ survey. • The survey was sent to a random sample of 10,700 addresses in Northumberland. A reminder questionnaire was sent to all those who did not respond to the initial mailout. • Fieldwork took place between the 30th June and the 24th August 2012. In total 3,620 people responded, representing an adjusted response rate of 34%. • Data are weighted to the known population profile of the area to counteract non-response bias. Data are weighted by age within gender bands, ethnicity and balanced by household size. • To enable comparisons with Place survey data, results are based on all valid responses (excluding don’t knows and those who do not answer the questions) unless otherwise indicated.
National backdrop… economic pessimism across the country continues Do you think that the general economic condition of the country will improve, stay the same or get worse over the next 12 months? Base: 1,005 British adults 18+, 20th-24th, October 2012 October 2012 Don’t know Get worse Improve Get worse Stay the same Improve Get worse Stay the same EOI = -14 Source: Ipsos MORI Political Monitor
Three in five respondents are in paid employment, 27% are retired. Three quarters of respondents are owner occupiers, 14% are social tenants and 9% private tenants. North Owner occupier Social tenant Private tenant Working Retired Education Workless South East Homemaker/other Owner occupier West Social tenant Owner occupier Private tenant Social tenant Private tenant Working Retired Working Retired Education Workless Education Homemaker/other Workless Homemaker/other Base: All valid responses (3205)
The general view of the economy is pessimistic, although less so at a local level EC1. In your view which best describes the state of the economy in…? Base: All valid responses (see above) Net Economic Performance -70 -82 -86
The current economic climate has affected three in five Northumberland residents in one form or another. EC2. Thinking of the current economic climate, have you been affected by any of the following in the last 12 months? % been affected Base: all valid responses (3328)
Two in five residents believe their financial circumstances will get worse over the coming year. EC3. Do you think that your personal financial circumstances will improve, stay the same or get worse over the next 12 months? % Don’t know % Improve Area Comparator data % Get worse % Stay the same Base: All valid responses (3527)
7 Views of the local area
There has been a fall in satisfaction with the local area. OS1. Overall, how satisfied or dissatisfied are you with your local area as a place to live? % Very dissatisfied % Fairly dissatisfied % Very satisfied % Neither Comparator data Area % Fairly satisfied Base: All valid responses (3580)
Road and pavement repairs and job prospects are the priority. OS9. Which of the things below would you say are most important in making somewhere a good place to live?OS10. And thinking about this local area, which of the things below, if any, do you think most need improving? Important Needs improving Base: OS9 All valid responses (3152) Base: OS10 All valid responses (3139)
Pot holes, pot holes, pot holes. % needs improving Road and pavement repairs Job prospects Street cleanliness Activities for teenagers Level of ASB Affordable decent housing Public transport Care and support for the elderly Shopping facilities Traffic congestion Cost of living Parks and green spaces Level of crime Health services Sport & leisure Community facilities Education provision and schools Tourist attractions Care and support for disabled people Sense of community Cultural facilities % important Base: All valid responses OS9 (3152); OS10 (3139)
And we try to look locally – Local Committee Areas… Issues which are more likely to need improving in these specific areas. • North: • Road and pavement repairs (61%) • Job prospects (44%) • Affordable decent housing (33%) • Level of traffic congestion (22%) • Wage levels and local cost of living (23%) • Education provision/schools (12%) • South East: • Clean streets (39%) • Facilities and activities for teens (31%) • The level of ASB (36%) • Shopping facilities (22%) • Facilities and activities for children under 13 yrs (23%) • Parks and green spaces (15%) • The level of crime (17%) • Sports and leisure facilities (14%) • Sense of community (12%) • West: • Road and pavement repairs (66%) • Affordable decent housing (29%) • Public transport (29%) • Care and support for older people (24%) Base: OS10 All valid responses (3139)
There is a strong sense of belonging, IN1. How strongly do you feel you belong to your local area? % Not at all strongly % Not very strongly % Very strongly Area Comparator data % Strongly % Fairly strongly Base: All valid responses (3462)
…social cohesion IN2. To what extent do you agree or disagree that your local area is a place where people from different backgrounds get on well together? % Definitely disagree % Definitely agree % Tend to disagree Area Comparator data % Neither % Agree % Tend to agree Base: All valid responses who live in a diverse area (3088)
…and community spirit. IN3. To what extent do you agree or disagree that people in this local area pull together to improve this local area? % Definitely disagree % Definitely agree % Tend to disagree Area Comparator data % Tend to agree % Neither Base: All valid responses (3313)
Doing better than most, although formal volunteering remains relatively low. IN4. How often, if at all, have you given unpaid help in the following ways? By taking part in or supporting any group, club or organisation As an individual to someone who is not a relative 26% volunteer formally once a month 25% in 2008 40% volunteer informally once a month Base: All valid responses (3448) Base: All valid responses (3458)
There is a willingness to work together to improve the local area. CL2. To what extent do you agree or disagree with the following statements? Base: All valid responses (see above) % Councils’ Average 2012 68% 55% % agree 73% 59%
But….that does not necessarily translate into feeling empowered. IN5. Do you agree or disagree that you can influence decisions affecting your local area? % Definitely agree % Definitely disagree % Tend to agree Area Comparator data % Agree % Tend to disagree Base: All valid responses (2894)
Council satisfaction has improved but remains below the consortium average. OS2. Overall, how satisfied or dissatisfied are you with the way the council runs things? % Very satisfied % Very dissatisfied % Fairly dissatisfied Comparator data Area % Fairly satisfied % Satisfied % Neither Base: All valid responses (3531)
The same for value for money. OS3. To what extent do you agree or disagree that the council provides good value for money? % Strongly agree % Strongly disagree % Tend to agree % Tend to disagree Area Comparator data % Neither % Agree Base: All valid responses (3451)
Northumberland’s reputation is not as strong as others. OS4. On balance, which of the following statements comes closest to how you feel about the council? OS5. How much do you trust the council? Consortium average % positive 36 53 Base: All valid responses (see above)
Significantly fewer residents believe that the council acts on their concerns. OS7. To what extent do you think the council acts on the concerns of its local residents? % A great deal % Not at all % A fair amount Area Comparator data % Not very much Base: All valid responses (3123)
But a larger proportion are now feeling informed. OS6. Overall how well informed do you think the council keeps residents about the services and benefits it provides? By benefits we mean any positive impacts it has had on the local area % Very well informed % Not informed at all Area Comparator data % Fairly well informed % Not very well informed % Informed Base: All valid responses (3409)
There is a broad range of opinion dependent upon the service in question.Users of non universal services are more satisfied than others. OS12. The council is a key provider of public services locally, so we would like your views on some of the services they provide. How satisfied or dissatisfied are you with each of the following services provided or supported by the council? Universal services Non-universal services Base: All valid responses (see above) Base: All valid responses (% satisfied valid responses / Service users (see above)
Doorstep recycling is an issue. Base: All valid responses (see above)
Individual services generally perform less well than the consortium average. Universal services Non-universal services Base: All valid responses (see above)
Two thirds of residents are positive about their health. AY6. How is your health in general? % Very bad % Bad % Very good % Fair Area Comparator data % Good % Good Base: All valid responses (3528)
The average mental well being score across Northumberland is 24.7 (between a range of 7 and 35). AY8. WEMWB short scaleBelow are some statements about feelings and thoughts. Please tick the box that best describes your experience of each over the last two weeks. Base: All valid responses (see above)
88% of residents score at least 20 out of 35 on the well being scale. However, 12% score less than 20 points, which suggests a low quality of mental well being. AY8. WEMWB short scaleBelow are some statements about feelings and thoughts. Please tick the box that best describes your experience of each over the last two weeks. 7-9 30+ 10-19 344 people (12%) scored less than 20 Workless (38%) Social tenants (23%) Disability (21%) Poor health (39%) 20-29 Base: All valid responses (3049)
One third of residents are carers AY12. Do you look after, or give any help or support to family members, friends, neighbours or others because of either long-term physical or mental ill-health or disability or problems related to old age? Age Yes 1213 people Disabled No Gender Ethnicity Base: All valid responses (3392)
In summary… • Levels of satisfaction with the local area have fallen (you are not alone). • Road and pavement repairs and economic stability are a priority. • Residents have a strong sense of belonging to their local area and there is a real sense of community spirit but only one quarter feel they can influence decisions. • Satisfaction with the Council is moving in the right direction. There have been improvements overall, more believe they are getting value for money and feel informed • ..but the reputation of the Council remains relatively weak. • There is an issue with doorstep/kerbside recycling. • Compared to the consortium, it is a game of two halves….you perform significantly better on local area and social cohesion measures and worse on general council and service specific key measures.
….so what does this mean • Important to note that key council satisfaction measures are improving. • The survey suggests its about key visible services…being seen to tackle holes in the road is visible PR. • Communicate what you can do and what you can not, to manage expectations at a local area level.
Thank you for listening! Any questions? Further information: Nicola.moss@ipsos.com 0161 240 2401
Respondent profile 1 Sample Profile for Northumberland : key demographics Weighted Unweighted Base size Gender Male 1557 Female 1941 Age 18-24 30 25-44 505 1402 45-64 65+ 1499 Ethnicity 3496 White 33 BME Base: All valid responses (see above) 41
Respondent profile 2 Religion Sexuality Base: All respondents (3620) 42
Household profile Household demographics Served in the armed forces (3316) Details of serving in the armed forces (620) Base: All valid responses (see above) *Base: All who have served or a member of their household has served in the armed forces 43
And we try to look locally – Local Committee Areas… Greater satisfaction with specific services at a small area level • North: • Street cleaning (57% satisfied) • Winter maintenance (28%) • Up keep of grass verges, flower beds, trees and shrubs in public places (50%) • Museums/galleries (35%) • Theatres/concert halls (36%) • West: • Local tips/recycling centres (82% satisfied) • Parks and green space (74%) • Local libraries (71%) • Museums/galleries (41%) • Theatres/concert halls (50%) • Sport and leisure facilities (66%) • South East: • Road maintenance (27% satisfied) Base: All valid responses (see above)
And we try to look locally – Local Committee Areas… Greater dissatisfaction with specific services at a small area level • North: • Road maintenance (66% dissatisfied) • South East: • Street cleaning (38% dissatisfied) • Up keep of grass verges, flower beds, trees and shrubs in public places (40%) • Local tip/recycling centres (11%) • Parks and green spaces (20%) • Museums/galleries (29%) • Theatres/concert halls (40%) • Sport and leisure facilities (31%) • West: • Road maintenance (69% dissatisfied) • Pavement maintenance (59%) • Up keep of grass verges, flower beds, trees and shrubs in public places (40%) Base: All valid responses (see above)
Health & Wellbeing at small area level Poor health Disability Well being index score Good health North South East West Base: All valid responses : Health (good/poor) (3528); Disability (3490); Wellbeing index score (3049)