Download
1 / 43
440 likes | 627 Views
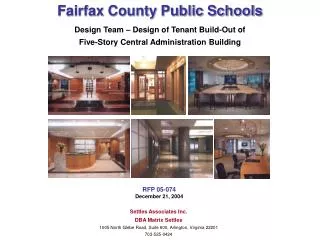
Fairfax County Public Schools FY 2005 Budget. Sully District Council March 24, 2004 Mario Schiavo Budget Coordinator. FCPS FY 2005 Budget. Key facts: Total $1.8 billion Slower growth in overall student membership

E N D
Fairfax County Public SchoolsFY 2005 Budget Sully District Council March 24, 2004 Mario Schiavo Budget Coordinator
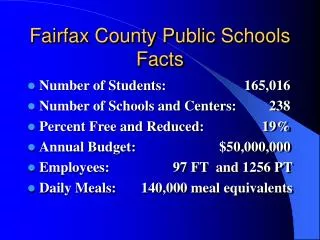
FCPS FY 2005 Budget Key facts: • Total $1.8 billion • Slower growth in overall student membership • Continued increase in students with limited English proficiency, students with disabilities, and students from low income homes
FCPS FY 2005 Proposed Budget Key facts: • FCPS bid to remain competitive in teacher recruitment • Significant increase in VRS contribution • Few program or service increases • Proposed cuts of $7.1 million in schools and departments
Support for Our Schools “We have to maintain our investment stream in our public schools to ensure that they are the best in the country.” Gerry Connolly, 10/21/03 “Our outstanding school system is the leading contributor to the success and attractiveness of Fairfax County.”Cathy Hudgins, 10/21/03 “I will continue to work with my community to make sure that education continues to be a major priority for funding…”Sharon Bulova, 10/17/03
Support for Our Schools “We provide a higher level of services than mandated and attract many families to our county strictly for the opportunity to have their children enrolled in these programs.”Dana Kauffman, 10/17/03 “Excellent schools are the bedrock for economic development, increasing property values, and essential for the future of Fairfax County.”Gerry Hyland, 10/17/03 “People keep flocking to Sully because of the quality of its schools and principals—and that’s clearly something I’m going to work to keep up.”Michael Frey, 10/16/03
Support for Our Schools “Public education is a priority in Fairfax County, and we must provide the resources to ensure that teachers can teach and children can succeed.” Penny Gross www.PennyGross.com “Our citizens simply do not consider services to be gold plated when they support a superb school system…and services that are models for the rest of the country. These are precisely the reasons they have moved to Fairfax County.”Elaine McConnell Spring 2003 Newsletter
Seventy-Five Percent of Revenue From Local County Taxpayers Federal Aid Includes Impact Aid, IDEA, andE-rate funding. $37.5 M State Aid Primarily SOQ funding. $210.8 M Sales Tax One cent of the state sales tax is designated for education. $121.8 M Beginning Balance $34.8 M City of Fairfax Payment to FCPS to provide educational services to the city’s 2,762 students. $29.2 M CountyTransfer Real estate and personal property taxes are the main source of county revenue. $1,361.2 M Other Revenue Includes student fees, out-of-county tuition, and building rental fees. $9.4 M
A Continuing Revenue Challenge We must ask Fairfax County for an increase of 9.7 percent. Revised County transfer guideline (6.57 percent as of February 2004) $81.6 FCPS transfer request (9.7 percent) $120.4 Revised deficit($38.8) ($ in millions)
Where it goes…FY 2005 Proposed Expenditures($ in millions) Transportation Includes bus driver salaries, replacement buses, and bus operations and maintenance. $87.6 M Facilities Management Includes costs related to the operation and maintenance of school buildings and equipment $85.0 M Instruction Includes costs associated with providing instructional programs. $1,549.1 M General Support Includes Costs associated with support services for finance, human resources, information technology, purchasing, and Leadership Team. $83.0 M
FY 2005 Authorized Positions Nonschool-Based 7.8% State/Federal Projects 2.1% School Custodians 6.6% School Office Personnel 6.4% School-Based Teachers 62.7% Instructional Assistants 10.2% Psychologists, Social Workers, and Instructional Specialists 1.4% School-Based Administration 2.8%
School-Based Position GrowthSchool Operating Fund • School-Based Between FY 2000 and FY 2005, a total of 1,891.7 school-based positions were added to the operating fund; this represents an11 percent increase • Nonschool-Based Between FY 2000 and FY 2005, a total of 67.6 nonschool-based positions were added using discretionary (operating) funds; this represents a 4.3 percent increase
168,000 166,000 166,780 164,000 164,667 163,386 162,000 161,385 160,000 Membership 158,000 158,331 156,000 154,000 154,523 152,000 150,000 148,000 FY 2000 FY 2001 FY 2002 FY 2003 FY 2004 FY 2005 Actual Actual Actual Actual Estimate Proposed Student Membership Increases
FY 2000 to FY 2005Trends in Membership Growth 90% 79.8% 80% 70% 60% 50% 40% 30% 18.1% 18.1% 20% 7.2% 10% 0% General Education Special Education Level Two Free and Reduced-Price Lunch ESOL
Growth in ESOL Membership 30,000 24,219 25,000 22,868 19,427 20,000 17,788 15,635 Students 13,467 15,000 10,000 5,000 0 FY 2000 Actual FY 2001 Actual FY 2002 Actual FY 2003 Actual FY 2004 Estimate FY 2005 Proposed Since FY 2000, ESOL membership has increased by 80 percent.
Growth in Special EducationStudent Membership and Total Services 60,000 49,713 48,186 47,494 50,000 45,310 44,880 39,133 40,000 Students and Services 30,000 24,098 23,314 23,472 22,162 21,302 21,871 20,000 10,000 0 FY 2000 Actual FY 2001 Actual FY 2002 Actual FY 2003 Actual FY 2004 Estimate FY 2005 Proposed Membership All Services
Growth in Students Eligiblefor Free and Reduced-Price Meals 34,000 33,113 33,000 32,024 32,000 30,657 31,000 30,199 30,000 Students 28,858 29,000 28,039 28,000 27,000 26,000 25,000 FY 2000 Actual FY 2001 Actual FY 2002 Actual FY 2003 Actual FY 2004 Estimate FY 2005 Proposed 20 percent of our students are eligible for free or reduced-price lunches.
FY 2005 Cost of Growth $7.1 Million General Education Transportation $0.9 M $1.8 M Special Education ESOL $2.0 M $2.4 M 12.6% 25.4% 33.8% 28.2%
Employee Compensation We are committed to makingFCPS employees the highest paidK-12 education employees in the metropolitan area AND to keepingFCPS competitive in the marketplace.
Compensation Initiativesfor Teachers • Market scale adjustment (3 percent) • Step increase for eligible employees(average 3.1 percent) • 195-day contract reduced by one day with no reduction in salary (0.5 percent) • Pick up of employee VRS contribution(0.5 percent) These initiatives will result in a total package of a 7.1 percent increase for eligible teachers.
Teacher Compensation* • The FY 2004 Montgomery County teacher salary will exceed the FCPS FY 2005 teacher salary even with the proposed increases. • FY 2004 salaries are higher in: • Alexandria Falls Church • Arlington County Montgomery County *Based on step 9, with master’s degree Source: Washington Area Boards of Education, 2004
Compensation Initiativesfor Support Employees • Market scale adjustment (2 percent) • Step increase for eligible employees (3.1 percent) • Restoration of step increase lost in FY 1992 • Minimum 10 percent salary increase for promotions • Pick up employee VRS contribution (0.5 percent) • Enhance FCERS retiree health subsidy These initiatives will result in a total package of a 7.1 percent increase for support employees.
Employee Compensation Increases ($ in millions) • Market scale adjustment $36.7 • Step increase33.1 • Employee initiatives9.0 - restoration of lost step - pick up of 0.5 percent VRS employee contribution - minimum 10 percent promotion salary increase - FCERS retiree health subsidy enhancement (more)
Employee Compensation Increases (cont.) ($ in millions) • Health insurance increase13.6 • ERFC rate increase11.0 • VRS projected rate increase29.1 • VRS life insurance increase9.8 • FCERS rate increase2.4 Total $144.7
Instructional Programs • At end of FY 2003 • Reduction of class size • Eight additional full-day kindergarten classes • Staffing initiatives for FY 2005($5 M) • Autism program • Elementary staffing initiative
Proposed Budget Reductions ($ in millions) • Summer school transfer 3.0 • Department reductions 2.7 • ACE administrative fee–summer school 0.9 • Substitute pay differential 0.5 Total $ 7.1
FY 2004 Per Pupil Costs Arlington County $13,950 Falls Church City $13,377 Alexandria City $12,198 Montgomery County, MD $10,644 Fairfax County $10,113 Loudoun County $ 9,604 Manassas City $ 9,038 Prince William County $ 8,205 Prince George’s County $ 8,014 Source: FY 2004 WABE Guide
Difficult Decisions $ in millions Previously restored reductions Elementary instructional assistants $4.0 182.0High school staffing adjustments 2.9 61.9Special needs schools–clerical support 0.9 31.5Custodial staffing 0.5 20.5 positions Additional reductions Autism Program 1.0 TBDReduce market scale adjustment by 1 percent 13.5 --Increase class size 13.0 TBDFY 2004 Third Quarter Budget Review 3.0 TBD TOTAL $38.8 295.9
State Commitment is Lacking • Virginia ranks 43rd in the nation in percentage of state budget allocated for public education • Virginia ranks 49th in state spending for education as a percent of personal income
What Happens Next? January 8 Superintendent’s budget presentation January 20 School Board work session January 26 School Board public hearing January 27 School Board public hearing February 5 School Board work session February 12 FY 2005 advertised budget adopted ?? Virginia Legislative Session Ends March 31 Budget presentation to the Board of Supervisors (BOS)
What Happens Next? March 29-31 BOS public hearings April 28 Transfer to schools set by BOS (tentative) May 10 School Board work session May 17School Board public hearing May 18 School Board public hearing (if needed) May 20 School Board work session May 27 School Board adopts FY 2005 approved budget
Citizen Participation To sign up to speak at a School Board public hearing, call 703-246-3646. To sign up to speak at a Fairfax County Board of Supervisors public hearing, call 703-324-3151. The Superintendent’s FY 2005 proposed budget is available at www.fcps.edu.
Fairfax County Public Schools 10700 Page Avenue Fairfax, Virginia 22030 www.fcps.edu
Verbal Average Math Average FCPS 546 564 1110 Virginia 514 510 1024 Nation 507 519 1026 FY 2003 Senior SAT Scores Highest FCPS scores ever!
All FCPS high schools among the top 4 percent in the nation* *TJHSST was not eligible for ranking because of its selective admissions process.2003 Newsweek Challenge Index
100% 80 60 40 20 0 FCPS Statewide The Standards of Learning 91 percentof our schoolsare fully accredited, compared to the statewide measure of 64 percent. Spring 2003 SOL Results
Advanced Placement • 47.6 percent of FCPS seniors enrolled in and passed one or more AP courses. • Total number of AP exams: 20,689. (up from 20,236 in 2002) • 64 percent of FCPS juniors and seniorsscored 3 or more. (sufficient for college credit) AP courses are offered in 16 FCPS high schools. FY 2003
International Baccalaureate • 44 percent of juniors and seniors in IB schools enrolled in and passed one or more IB courses. • 25 percent increase in the number of exams taken over 2002. • 80.8 percent of students scored 4 or more. (sufficient for college credit) IB courses are offered in 8 high schools. FY 2003
Closing the Gap • SOL achievement gap diminished 1998–2003. • Black students–20 percent • Hispanic students–19 percent • 2003 SAT verbal and math scores for minority students exceed national and state averages. • Black students–38 points verbal; 45 points math • Hispanic students–44 points verbal; 42 points math • Hispanic student participation in AP tests at all-time high.
FCPS Students Excel in International DECA Competition TJHSST Student Among 16 International Student Astronauts FCPS Students Win 14 Awards at Intel Science and Engineering Fair 210 FCPS Students Named National Merit Semifinalists Chantilly Academy Students Attend Ceremony at the White House Lake Braddock Students Win Award for Cancer-Suppressing Device FCPS Students Capture Awards at Model U.N. Conference FCPS Students Make Headlines
184 FCPS Teachers Hold National Board Certification—27 New This Year FCPS Teacher, Counselor Recognized by Governor Warner FCPS’ Great Beginnings Program to Be Used as Statewide Model Three FCPS Principals Receive TEC Champion Leadership Awards FCPS Honored as One of Top IT Organizations Stuart High Selected as Exemplary High School by NASSP Hunters Woods Elementary Receives National Recognition From NAESP South Lake High Receives Bridge Builders Grant From Met Life FCPS Students Make Headlines
Team Effort • FCPS continues to provide the value it has promised. • Last fall, the voters in Fairfax County gave the schools a strong vote of confidence. • Now we must seek the community’s continued support.