Download

1 / 11
110 likes | 296 Views
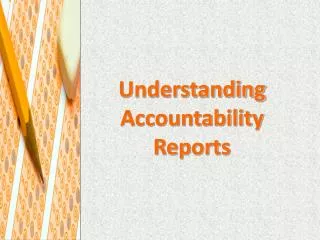
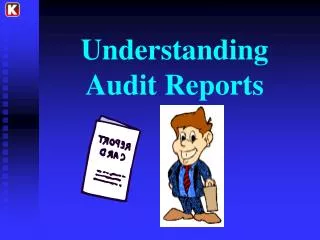
Understanding Accountability Reports. Where Do I Find These Reports?. Counselor Principal School Improvement Specialist System Testing Coordinator State Department Website. A labama R eading M athematics T est. School Group Report. Grade Level. School Code Name of Stem Test Date.

E N D
Where Do I Find These Reports? • Counselor • Principal • School Improvement Specialist • System Testing Coordinator • State Department Website
Grade Level School Code Name of Stem Test Date School Name
Number Tested: Total students tested Mean Scaled Scores: The reading and mathematics test are scaled. The mean scaled score tells you where an individual or group fall on that scale. The scaled score can be used to monitor progress from year to year.
Achievement Levels: Standards have been set in order to report the group’s overall performance in reading and math by an achievement level. There are 4 achievement levels: Level I – Does not meet academic content standards Level II – Partially meets academic content standards Level III – Meets academic content standards Level IV- Exceeds academic content standards Non-Proficient Proficient The number and percent of students per achievement level is displayed.
Points Possible: Indicates how many total points are possible for that content standard and how many points are possible by item type (multiple-choice, gridded, or open-ended).
Points Earned : Indicate how many points of the total possible are earned for each content standard and by item type (multiple-choice, gridded, or open-ended).
Mean Percent Correct Indicates the average percent correct for the group on each content standard.
How Do I Use These Reports? • Make class profile sheets • Plan individual remediation • Adjust instruction • Goal setting • Determine the strength of the core program • Longitudinal Study for each core subject • Prediction for AYP