Download
1 / 16
160 likes | 249 Views
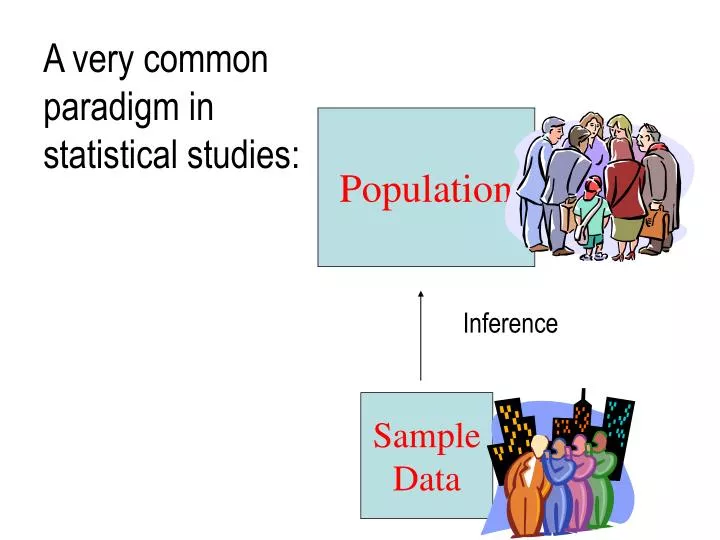
A very common paradigm in statistical studies:. Population. Inference. Sample Data. Scientific Savvy Article. A New York Times article (“Scientific Savvy? In U.S., Not Much”, Aug. 30, 2005) profiled a man who studies what Americans know about science.

E N D
A very commonparadigm instatistical studies: Population Inference Sample Data
Scientific Savvy Article A New York Times article (“Scientific Savvy? In U.S., Not Much”, Aug. 30, 2005) profiled a man who studies what Americans know about science. He uses surveys to assess this knowledge.
What Americans don’t know From the article: American adults in general do not understand what molecules are (other than that they are really small). Fewer than a third can identify DNA as a key to heredity. Only about 10 percent know what radiation is. And my personal favorite: One adult American in five thinks the Sun revolves around the Earth. How is it possible to make claims like this?
A Smoking Paradox Another New York Times article (“Habits: Menthol May Add a Danger for Smokers”, Aug. 30, 2005) opens with a baffling fact: “Black smokers tend to smoke fewer cigarettes than white smokers do, researchers have found. Yet they seem to be at higher risk for smoking-related diseases like lung cancer and heart disease.” Does this mean blacks are simply more susceptible? Not necessarily! Do NOT suppose that association means causation!
A clue to the smoking puzzle? From the article: According to one of the studies, led by Carolyn C. Celebucki of the University of Rhode Island, black smokers prefer menthol cigarettes two to one over regular ones, the reverse of the pattern among white smokers. So it might be that menthol is the real culprit. Often, an association (e.g., between race and smoking-related disease) can be explained by a completely different variable (e.g., menthol content).
Main ideas • Often, we wish to know about some population of interest (like adults in the U.S.). But that entire population is unreachable, so we take a REPRESENTATIVE sample to learn about it. • Do NOT fall into the trap of trying to infer causation from a statistical study (unless the study is a randomized experiment).
2 types of studies to obtain data relevant to your research: • Randomized Experiment • Observational Study Experimenter randomly assigns people to treatment or control group Experimenter merely observes things about people in the sample
Randomized Experiment • Subjects are randomly assigned to treatment and control (or treatment 1 and treatment 2) • Measurements are recorded. • Then differences in the data between treatment and control can be said to be CAUSED by the treatment. Example: See articles on yoga study.
Observational Study • Subjects are drawn at random from two separate populations. • We do not get to randomly assign subjects to the different populations. • Measurements are recorded.
Observational Study Continued • We then have two separate samples and differences are said to be ASSOCIATED with which population was sampled. • We cannot claim that membership in a particular population caused the difference. Example: See articles on positive outlook.
To conduct a statistical study properly, one must get a representative sample. Let’s look at a disastrous example in which this was not done.
Literary Digest 1936: This magazine mailed a questionnaire to over 10 million people vs. VS.
Survey Results: • 2.4 million responded! • 43% were for Roosevelt • Literary Digest predicted a landslide victory for Alf Landon
Magazine Results: • Literary Digest went bankrupt shortly thereafter.
FATAL FLAWS: • Sampling bias: The 10 million people to whom questionnaires were sent were chosen from phone lists, club membership lists, and its own subscription list • Response bias: The people who responded were not representative; many more republicans than democrats had strong feelings is called using the wrong sampling frame and (b) is called volunteer response.