Download
1 / 30
300 likes | 454 Views
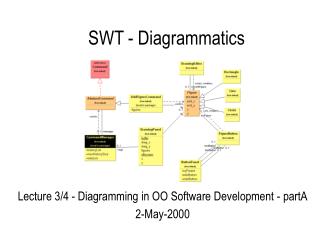
SWT - Diagrammatics. Lecture 4/4 - Diagramming in OO Software Development - partB 4-May-2000. Previous Lecture Review. OO Introduction, OO Design Notations, Booch-OMT-UML Objects, Messages / Control & Data Flow, Classes. Class Attributes and Operations,

E N D
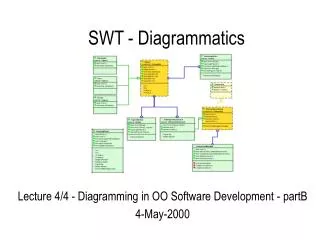
SWT - Diagrammatics Lecture 4/4 - Diagramming in OO Software Development - partB 4-May-2000
Previous Lecture Review • OO Introduction, • OO Design Notations, Booch-OMT-UML • Objects, Messages / Control & Data Flow, Classes. • Class Attributes and Operations, • Visibility of Attributes and Operations, • Relationships : • Association, Multiplicity, Aggregation, • Dependency, Inheritance. • Object Oriented Views
Overview • Introduction to UML • Goals, History - Timeline, External influences • The 9 types of UML diagrams : • Use Case, Class, Object, Sequence, Collaboration, • Statechart, Activity, Component, Deployment • Flow of data between views • UML references
UML • Unified Modelling Language UML • Comprehensive syntax • Language, Process and Tool independent. • Four goals : • To represent complete systems • To establish explicit coupling between concepts and executable code • To take into account scaling factors • To allow use by both humans and computers
UML Timeline Sep 1997 Jan 1997 1995 1996 Various OO Methodologies Unified Method 0.8 Unified Method 0.9 Booch’93 UML 1.0 Booch’91 UML1.1 OMT-2 OMT-1 UML Partners OOSE
External Influences Origin Element Booch Categories / Subsystems Embley Singleton classes / Composite objects GOF Frameworks / Patterns Harel Statecharts Jacobson Use Cases Meyer Pre/Post conditions Odell Dynamic classification / Events OMT Associations Shlaer-Mellor Object Lifecycles Wrifs-Brock Responsibilities / Collaborations
UML diagram types User Requirements 1.Use Case : system functions from a user’s perspective Static Structure 2.Class : objects and their relationships 3.Object : classes and their relationships Interaction 4.Sequence : dynamic object interaction 5.Collaboration : object and their links/interactions 6.Statechart : behaviour of a class that has states 7.Activity : operation behaviour (as a set of actions) Implementation 8.Component : software components 9.Deployment : software on particular hardware platforms
1. Use case diagrams • Use case diagrams : • Describe the behaviour of a system from a user’s perspective. • Depict relationships between the system and its environment. • Allow the definition of the systems’ boundaries. • A use case diagram can be seen as an instance of interaction between “actors” and the system. understands Analyst expresses User Use case verifies implements designs Tester Programmer Architect
Use Case diagrams • May contain any of the following relationships : • Communicates : • Uses : • Extends : triggers Use Case B <<uses>> Use Case A Use Case B <<extends>> Use Case A Use Case B
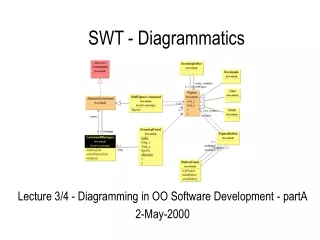
2. Class Diagrams Multiplicity : 1,0..1,*,M..N, N, M..* Abstract Class Name Inheritance Class name Class name Association + Public Attribute # Protected Attribute - Private Attribute Aggregation Class name + Public Operation( ) # Protected Operation( ) - Private Operation( ) Dependency Class name
3. Object Diagrams • An object/instance diagram represents a concrete situation at a given time. • It expresses both the static structure -found in class diagrams- and behaviour. • Object diagrams contains objects connected by links. • Object Diagrams are mainly used to show a context of interaction or to facilitate the understanding of a complex data structure.
An Object Diagram example 1 1 w1 : Wheel Car Engine myCar : Car 1 w2 : Wheel = 4 Wheel w3 : Wheel Composition with : myEngine : Engine w4 : Wheel Or containment : myCar : Car myEngine : Engine
4. Sequence Diagrams • Sequence diagrams focus on displaying the interaction between objects, without representing explicitly the context of interaction and the object’s state. • Depicting the chronology of the message broadcast, they are useful in all stages of OO modelling. : Caller : Phone : Recipient picks up dial tone dial ring picks up says hello...
5. Collaboration Diagrams • Collaboration Diagrams express both the context of a group of objects and the interaction between these objects. • Can be considered to be an extension of Object diagrams, adding notation to represent object interaction. • Messages are depicted using lines decorated with an arrow that points towards the recipient. • To indicate the sending order, messages are explicitly numbered.
A Collaboration Diagram example stocktem: Item 3 : *get myitem: Item 2 : get details 4 : getProperties myOrder: Order 1 : Enter item description op: OrderProperties
6. Statechart Diagrams • A state machine can be used to describe formally the behaviour of objects in terms of states and events. • Statecharts represent with : • states : the state of an object • transitions : the passing from one state to another • events : the occurrence of a given situation • guards : conditions for the triggering of events • actions and activities : operations of an object intermediate initial final event event [cond]
Two StateChart diagrams byte read rinsing washing drying URL delay H prefix read opened door wait for length closed door Opened door length read read data byte read [Count<Length] Suffix read [Count==Length]
7. Activity Diagrams • Activity diagrams are : • a variant of statechart diagrams, organised according to actions. • targeted towards representing the internal behaviour of a method, a mechanism or a use case. • An activity is represented by a round rectangle : • Decisions are represented using a diamond : • Synchronisation bars are used for synchronisation • Swimlanes are used to split the activity diagram in regions.
An Activity Diagram example Get temperature [ too cold ] [ too hot ] Cool down Heat up Open windows Switch off heating
8. Component Diagrams • Component diagrams depict software components and their relationships within the implementation environment. • Components can be all kind of software elements : files, libraries, databases etc. • Components contain two parts : • A dependency relationship between components usually represent compilation dependencies. • Components may contain processes using containment and can be grouped in subsystem components. Body Specification A B
A Component Diagram example Order Processing System UI Data Processor Data Manager External System Database
9. Deployment Diagrams • Deployment diagrams are used to illustrate the physical layout of the various hardware components that are needed for a system to operate. • Hardware resources are represented by a cube : • Lines annotated with multiplicity information are used to connect cubes. DB Server B A 0..1
A Deployment Diagram example CMServers <zeus> CMclientJFC Naming Server <robin> CMServers <robin> CMclientAWT CMclientCMD
Flow of data between views Interaction Model classes interactions operations Object Model Use Case Model Classes & Attributes events classes State Model states operations Business Model -> Logical Model -> Component Model -> Deployment Model
UML references UML at rational : http://www.rational.com/uml/ List of tools supporting UML diagrams : http://plg.uwaterloo.ca/~migod/uml.html Cetus page on UML : http://www.cetus-links.org/oo_uml.html