Download
1 / 14
150 likes | 287 Views
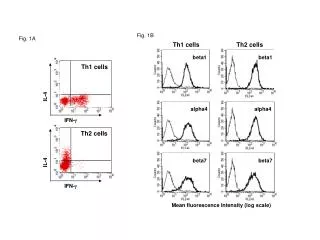
Th1 cells. Th2 cells. IL-4. IL-4. IFN- g. IFN- g. Fig. 1B. Fig. 1A. beta1. beta1. Th1 cells. alpha4. alpha4. Th2 cells. beta7. beta7. Mean fluorescence Intensity (log scale). Rolling. Sticking. 1200. 2.500. 5000. 1200. 2500. 5000. 300. 700. 1500. 300. 700.

E N D
Th1 cells Th2 cells IL-4 IL-4 IFN-g IFN-g Fig. 1B Fig. 1A beta1 beta1 Th1 cells alpha4 alpha4 Th2 cells beta7 beta7 Mean fluorescence Intensity (log scale)
Rolling Sticking 1200 2.500 5000 1200 2500 5000 300 700 1500 300 700 1500 Fig. 1C 60 60 Th1 cells Th1 cells 50 50 40 40 30 30 20 20 10 10 0 0 Number of cells/0.2 mm2/30 sec 60 60 Th2 cells Th2 cells 50 50 40 40 30 30 20 20 10 10 0 0 MAdCAM-1 (sites/mm2) VCAM-1 sites/mm2)
1800.0 1800.0 1600.0 1600.0 1400.0 1400.0 1200.0 1200.0 Th1 cells Th2 cells Chemotaxis (arbitrary units) 1000.0 1000.0 Th1 Th1 CCR4 CCR4 Th2 Th2 800.0 800.0 Th2 cells Th1 cells 600.0 600.0 400.0 400.0 0.1 1 10 100 1000 1 10 100 1000 200.0 200.0 Chemokine concentration (ng/ml) 0.0 0.0 MDC/CCL22 TARC/CCL17 Mig/CXCL9 I-TAC/CXCL11 CXCR3 CXCR3 2500.0 Fig. 2B Fig. 2A MDC/CCL22 2000.0 1500.0 1000.0 500.0 0.0 Chemotaxis (arbitrary units) 1 10 100 1000 1600.0 I-TAC/CXCL11 1400.0 1200.0 1000.0 800.0 600.0 400.0 200.0 0.0 1 10 100 1000 Mean fluorescence Intensity (log scale) Chemokine concentration (ng/ml) Fig. 2C
Th2 cells L1.2-hCCR4 cells Th2 cells CCL22 CCL17 CCL17 CCL22 0 200 400 600 800 1000 0 200 400 600 800 1000 Time (s) Time (s) L1.2-hCCR4 cells Th2 cells CCL17 CCL22 CCL22 CCL17 0 100 200 300 400 500 Time (s) 0 100 200 300 400 500 Time (s) Th1 cells CXCL9 CXCL11 CXCL11 Th1 cells CXCL9 0 100 200 300 400 500 Time (s) Time (s) 0 100 200 300 400 500 Fig. 2D Intracellular Calcium Mobilization (MFI)
TH1 CCR4= 8.4 CXCR4=20 beta1=144 alfa4=182 beta7=165 CXCR3=54
TH2 CCR4= 43.9 CXCR4= 33.9 beta1= 270 alfa4= 277 beta7= 217 CXCR3= 8
Glass capillary 2 dynes/cm2 Chemokine Adhesive substratum Dynamic cellular interactions under flow conditions
Th1 cells 60 50 40 Total interactions Total interactions 30 Rolling Rolling 20 Sticking >10s Sticking >10s 10 0 Number of cells in 0.2 mm2/30s Th2 cells 0.1 mg/ml 0.5 mg/ml 1 mg/ml 0.1 mg/ml 0.5 mg/ml 1 mg/ml 70 60 50 40 30 20 10 0 MAdCAM-1 Interactions of Th1 and Th2 cells with MadCAM-1 under flow
None None MDC MDC TARC TARC Total interactions Rolling Sticking >10 s Total interactions Rolling Sticking >10 s Interactions of Th1 and Th2 cells with MadCAM-1 under flow Th1 cells 50 40 30 20 10 0 Number of cells in 0.2 mm2/30s Th2 cells 50 40 30 20 10 0 MAdCAM-1
None None SDF-1 SDF-1 Th1 cells Th2 cells None None IP-10 IP-10 120 120 Total interactions Total interactions Total interactions Rolling Rolling Rolling Sticking >30 s Sticking >30 s Sticking >30 s Total interactions Rolling Sticking >30 s 100 100 80 80 60 60 40 Number of cells in 0.2 mm2/30s 40 Number of cells in 0.2 mm2/30s 20 Th1 cells Th2 cells 20 0 0 120 100 120 80 100 60 MAdCAM-1 MAdCAM-1 80 40 60 20 40 0 20 0 Interactions of Th1 and Th2 cells with MadCAM-1 under flow
None MDC TARC Th1 cells 60 None 50 MDC 40 Total interactions Rolling Sticking > 10s Total interactions Rolling Sticking > 10s TARC 30 20 10 0 Number of cells in 0.2 mm2/30s Th2 cells 60 50 40 30 20 10 0 VCAM-1 Interactions of Th1 and Th2 cells with VCAM-1 under flow
None None IP-10 IP-10 Th1 cells 120 100 Total interactions Rolling Sticking > 10s Total interactions Rolling Sticking > 10s 80 60 40 20 0 Number of cells in 0.2 mm2/30s Th2 cells 120 100 80 60 40 20 0 VCAM-1 Interactions of Th1 and Th2 cells with VCAM-1 under flow