Download
1 / 23
230 likes | 356 Views
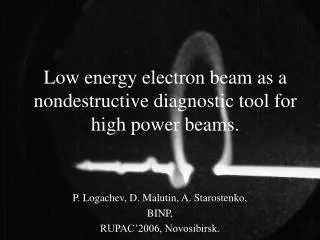
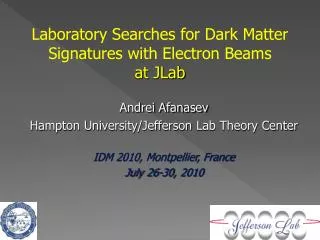
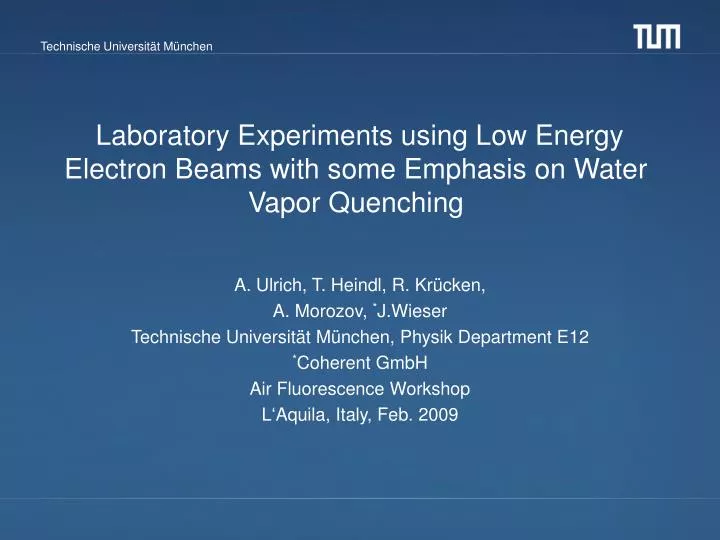
Laboratory Experiments using Low Energy Electron Beams with some Emphasis on Water Vapor Quenching. A. Ulrich, T. Heindl, R. Krücken, A. Morozov, * J.Wieser Technische Universität München, Physik Department E12 * Coherent GmbH Air Fluorescence Workshop L‘Aquila, Italy, Feb. 2009. Contents.

E N D
Laboratory Experiments using Low Energy Electron Beams with some Emphasis on Water Vapor Quenching A. Ulrich, T. Heindl, R. Krücken, A. Morozov, *J.Wieser Technische Universität München, Physik Department E12 *Coherent GmbH Air Fluorescence Workshop L‘Aquila, Italy, Feb. 2009
Contents • I) Comparison of “p’ experiments” and “decay time” measurements • II) The relevance of “water quenching” • III) Results of our experiments (Eur. Phys. J. D 33, 207 (2005)) Foto: J. Wieser
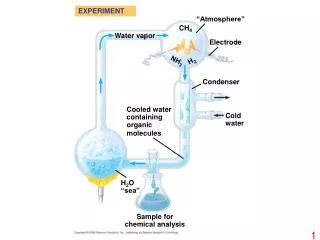
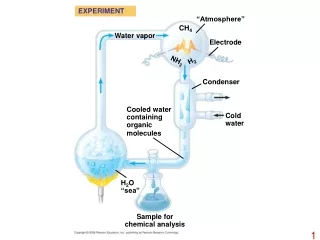
Light Production by Particle Collisions The elementary process of light production: Collisional excitation of atoms or molecules and the subsequent emission of photons: Proj + X Proj‘ + hν Proj‘ Electron or Ion (Proj) Photon (hν) Atom or molecule
The simplest case of data analysis: ? n* radiative Transition ro Collisionally induced transitions Two types of measurements which should match! Measuring p’ or r0 and all Qq
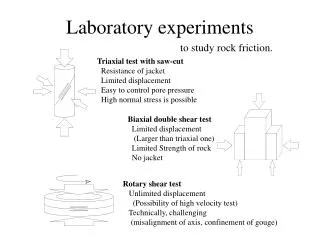
Method for Inducing Particle Collisions E Detection Issues: Intensity vs. pressure Pulsed excitation, time resolved measurement Global light output vs. local light output (Correction for geometry effects)
The p’ Method: Data always have to be extrapolated to 0 pressure! The geometry of the light emitting volume will always change! There may be a background, scattered light etc. For an example: See Thomas Heindl
The Decay- Time Method: The exponential decay has to be extracted from: The time structure of the excitation pulse! The background signal appearing at late times after the excitation! Slowing down times of the projectiles may have to be considered! The t – axis has to be well calibrated! In case of ”TAC” spectra: “Clean” statistics
Tilo Waldenmaier et al.: Astro-ph Feb 2008 A. Morozov et al.: Euro Phys. J D 46, 51 (2008)
Intermediate summary: • Both measuring techniques have their problems: • Decay time measurements need short excitation pulses, a good dynamic range of the data, a reliable analysis and fitting procedure • The p’ measurements have the problems of variation in the geometry of the light emitting volume with pressure • Also: The “physics” connecting the two measurements may not be as simple as assumed! • In practice this may cause a conceptual problem: Should the air shower experiments be analysed via tables of p’ values for all conditions found in the atmosphere or via calculation starting from N2 data? A combination of both techniques may be desireable but conceptually wrong.
A Comparison for Specific Data The most frequently studied case: N2*: C-B 0-0 transition at 337nm r0 = (2.66 ± 0.1) × 107 s-1 Q0 = (1.27 ± 0.04) × 10-11 cm3s-1 Results in a p’ of p’ = 78.9 hPa with an error on the order of 4% Comparison with the same method: Tilo Waldenmaier: p’ = 92.2 hPa Difference of 14% Comparison with recent directly measured p’ values:
Pure nitrogen self-quenching vs. quenching by oxigen (air, 21%) The strong oxigen quenching relaxes the influence of the nitrogen quenching ! May be that the oxigen quenching needs more attention! Airfly: p‘=3.796 hPa; Panchesny: Q=3 and 3.4×10⁻¹⁰cm3/s p‘=2.9 to 3.3hPa
The Issue of N2* Quenching by Water Vapor: Available data (C, v=0): AIRFLY: p’=1.28 hPa Tilo Waldenmaier: p’=1.82 hPa Q=(5.43±0.12)×10-10 cm3/s Andrei Morozov: p’=1.39 hPa Q=(7.1±0.7) ×10-10 cm3/s The difference between AIRFLY and Andrei Morozov is only about 8% The data were recorded at up to 25 hPa and 1.4 hPa, respectively !
About water vapor in the atmosphere Maximum amount of water: 3 to 30 g/m3 for –10 to 30 dec C
Result: The 0 and 4 km altitude cases of water content in air at 60% rel. humidity: From 2.2 to 22 hPa partial pressure!
An overview over the “budged” of quenching data: So far we have been working with quenching data – so the data are shown and compared in the “quenching world” and only for the C(v=0) level: Optical decay rate: 2.66×10⁷ 1/s N2* quenching by N2: Q=1.27×10⁻¹¹ cm3/s N2* quenching by O2: Q=30×10-11 cm3/s N2* quenching by H2O: Q=71×10-11 cm3/s Two scenarios: Ground-level, 30 deg. C., 60% rel. hum., 1000 hPa total pressure Max. Intensity effect due to water vapor: Iwet/Idry = 0.84; 16% effect 4km - level, -10 deg. C., 60% rel. hum., 600 hPa total pressure Max. Intensity effect due to water vapor: Iwet/Idry = 0.86; 14% effect Example: I ~ 1/(1+(26N2 + 165O2 + 42H2O)/2.66)
Aspects concerning water vapor measurements: • Nitrogen or air with a well defined water concentration is difficult to prepare • Water vapor is adsorbed or released from the walls of the target cell • Water vapor pressure is difficult to measure accurately • UV light and the beam may dissociate water molecules • Some solutions: • Gold covered walls of the target cell • Concentration measurement with a high precision capacitive manometer
C (v=0) quenching data C (v=1) quenching data
Future experiments that could be performed: A) A p’ measurement with reduced geometry problems Ulbricht sphere p e-gun sensitive USB spectrometer target cell fiber optics Expected results: Rel. Intensities of the bands, p’ values, absolute yield values B) Measurement of the quenching constant for O2 if it seems to be necessary ? It would / will require a shorter electron beam pulse (Photocathode ?)