Download
1 / 22
510 likes | 896 Views
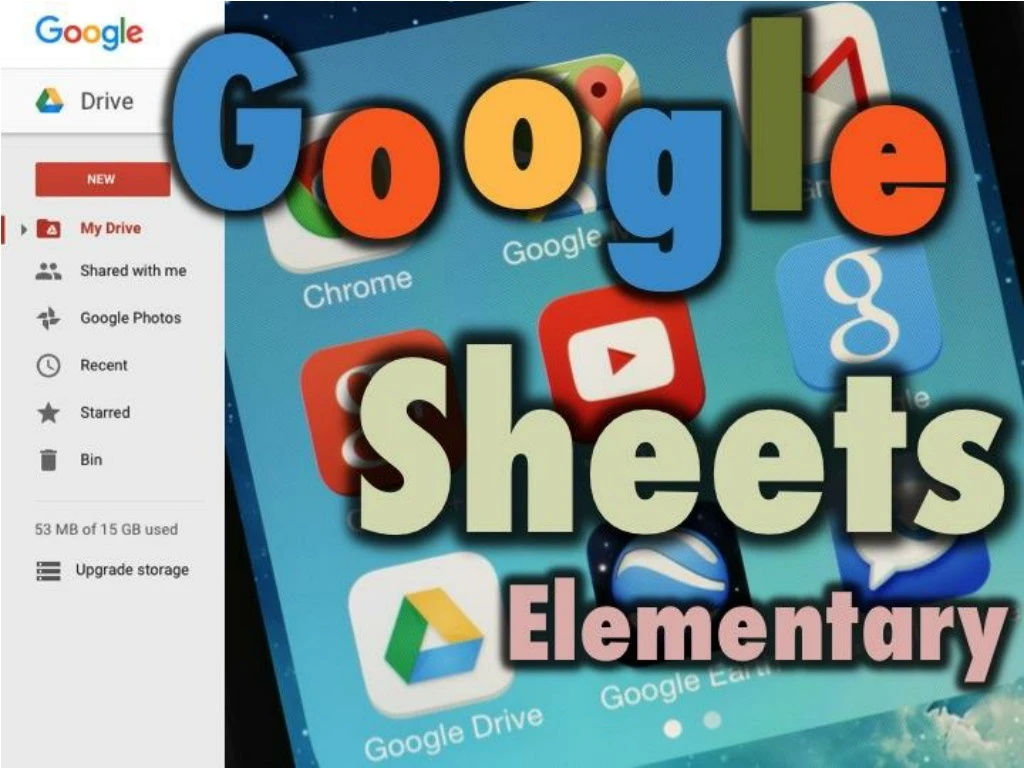
Google Sheets. Google Sheets is a spreadsheet program You can create charts of your information so that it can be quickly and easily understood It is Free to use Similar to Microsoft Excel. Getting Started. 1. 2. From the Google homepage, select Drive. Getting Started. Click on New

E N D
Google Sheets • Google Sheets is a spreadsheet program • You can create charts of your information so that it can be quickly and easily understood • It is Free to use • Similar to Microsoft Excel
Getting Started 1 2 From the Google homepage, select Drive
Getting Started Click on New Select Sheets
Spreadsheets ROW (Horizontal) Spreadsheets consist of columns (vertical) and rows (horizontal) The intersection of a row and column is called a CELL COLUMN (vertical) Letters indicate COLUMNS and Numbers indicate ROWS
Spreadsheets A Row is a group of cells that run horizontally. Rows are numerically labeled A Column is a group of cells that run vertically. Columns are alphabetically labeled. Cells are the intersection of a Row and Column Cells are identified by first stating the intersecting column letter followed by the intersecting Row number For example, B2 is an example of a cell address
Charts are used to show information so that it can be easily understood Types of Charts Line Graph Column or Bar Graph Pie Graph
Chart Title Chart Components Values Axis (Y–axis) Legend Category Labels Category Axis (X-axis)
Toy Sales Activity(Creating a chart) Follow the steps on the next slides…
Step 1: Type these words and numbers into the cells in a Google Sheet
Step 2 • Select all the cells by starting in cell A3 • Hold down your left mouse button and drag across and down until you have selected just the 8 cells • Make sure you have not highlighted any other cells than these 8 Cells Cell A3 Start Here
Step 3 Go to Insert - Chart
Step 4 • Click this Pie Chart • Press Insert
Step 5 • The Pie Chart will be placed into your Google Sheet • Drag it over so it is not covering up your other information
Step 6 Go back and follow the steps again to create 2 other types of Charts Don’t forget to highlight the 8 cells! 2 Other Charts
Title Step 7: Click here to change the title to Toy Sales
Google Sheets Print Borders Chart Functions Align Undo Font
Activity #2 Type these words and numbers into the cells in a Google Sheet Create 3 Charts Title the Sheet - Halloween Treats Look at the next slide for hints…
Specializing in PowerPoint presentations that share cutting edge technology and examine revolutionary businesses Link to store http://www.teacherspayteachers.com/Store/Gavin-Middleton
Thank you for downloading this PowerPoint • I hope that you and your students enjoyed it! • If you provide Positive Feedback and Follow Me, I will send you a Free Lesson of your choice ($4 or less value). • E-mail me at gavin@eastdalebusiness.com to receive your free PowerPoint. To view or purchase more materials here is a link to my store http://www.teacherspayteachers.com/store/gavin-middleton