Download
1 / 17
170 likes | 178 Views
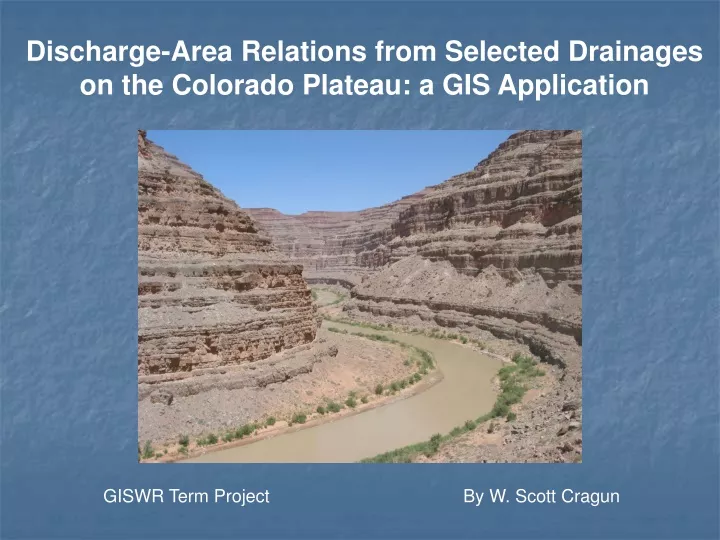
Discharge-Area Relations from Selected Drainages on the Colorado Plateau: a GIS Application. GISWR Term Project By W. Scott Cragun. Outline Problem to be addressed Part I Methods Results Conclusions Part II Methods Results Conclusions.

E N D
Discharge-Area Relations from Selected Drainages on the Colorado Plateau: a GIS Application GISWR Term Project By W. Scott Cragun
Outline • Problem to be addressed • Part I • Methods • Results • Conclusions • Part II • Methods • Results • Conclusions
Problem to be addressed: • A is often substituted for Q in fluvial models • Example: Family of equations knows as Stream Power Laws • Used to: • model aggradation / incision within rivers • model incision rates within rivers • Basic Equations: Z = kQmSn OR Z = kAmSn • k is proportionality constant • Q is discharge • S is slope • m/n are exponents whose values are debated • A is drainage area
Commonly held that: • Q = bAc; A is the contributing drainage area • b is a proportionality constant • c is a scaling exponent (1 is most common value) • Most commonly a linear (or nearly linear) relation • Perhaps true for alluvial rivers in humid climatic zones • What about for mixed alluvial-bedrock rivers in semi-arid climatic zones?? From: Mitchell, D.K., 2000
Part I - What I’ve Done: • Six river basins selected • Gunnison River • Upper Colorado River • San Juan River • Paria River • Little Colorado River • Fremont/Dirty Devil River • Encompass the southern/arid basins and the northern/relatively wetter basins
Part I - What I’ve Done: • The raw DEM’s • DEM’s downloaded from USGS seamless data • (http://seamless.usgs.gov/) • 30m DEM projected in UTM and interpolated at 100m cell size • Run TauDEM tools in order to determine flow direction and flow accumulation Upper Colorado Fremont Gunnison Paria San Juan Little Colorado
Part I - What I’ve Done: • Obtain USGS gaging station data for each of the 6 drainages • (http://waterdata.usgs.gov) • Mean annual flow • Mean peak flow • 35 total gaging stations • Import gage location in GIS • Manually extract contributing area at each • gaging station • compare GIS contributing area to USGS drainage area • plot discharge against contributing drainage area Little Colorado River
Part I - Results: • Significantly more scatter in the data from the • Colorado Plateau Y = 0.08A0.95 R2 = 0.82
Part I - Results: • Individual basins show unique downstream discharge patterns
Part I - Results: • Hydrographs show peak runoff during - spring (snow melt) : northern drainages • - fall (monsoon) : southern drainages northern drainages southern drainages
Part I - Results: • However… Individual basins show: 1) grouping of 3 northern basins • 2) unique relations in southern 3 basins
Part I - Results: • Splitting drainage basins into two groups…
Part I - Conclusions: 1) Close Q-A relation in northern drainages But… scaling exponent (c) is not nearly 1 : value is 0.70 - suggests that streams in humid environments are capable of generating greater discharges per unit drainage area than in arid and semi-arid regions 2) Large scatter in Q-A relation in southern drainages (lower r2) Suggests that - geologic controls influence discharge generation - climatic influence = greater evaporation 3) Discharge generation per unit area varies between all 6 basins 4) Streams in ARID regions: appropriate Q-A relation should be carefully chosen even when significant water is available
Part II - What I’ve Done: • Obtain precipitation data for western US from PRISM • (http://www.wcc.nrcs.usda.gov/climate/prism.html) • clipped out for each drainage • resampled at 1000 m cell size • Can RUNOFF be predicted from PRECIPITATION ?? • runoff coefficients estimated for each basin From: http://www.dot.ca.gov/hq/oppd/hdm/pdf/chp0810.pdf
Part II - Results: • Initial runoff coefficients too high • Readjusted to better predict runoff
Part II - Results: • First attempt to define precipitation-runoff relation through regression failed • Try, try again… San Juan shaded relief map San Juan precipitation map
Part II - Conclusions: • Estimated runoff coefficients vary widely between 6 basins • 0.0084 to 0.30 • Suggests that - local climate conditions influence discharge • monsoon vs. snow melt • - local geologic characteristics influence discharge • - local soil and vegetation distribution affects discharge • 2) Runoff prediction from precipitation is not perfect • oversimplified • 3) Need a more robust coverage of drainage characteristics to establish • representative discharge – precipitation relations in each basin