Download
1 / 29
290 likes | 427 Views
Modeling Errors in GPS Vertical Estimates. Signal propagation effects Signal scattering ( antenna phase center/multipath ) Atmospheric delay ( parameterization, mapping functions ) Unmodeled motions of the station Monument instability

E N D
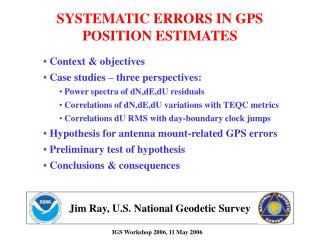
Modeling Errors in GPS Vertical Estimates • Signal propagation effects • Signal scattering ( antenna phase center/multipath ) • Atmospheric delay ( parameterization, mapping functions ) • Unmodeled motions of the station • Monument instability • Loading of the crust by atmosphere, oceans, and surface water
Modeling Errors in GPS Vertical Estimates • Signal propagation effects • Signal scattering ( antenna phase center/multipath ) • Atmospheric delay ( parameterization, mapping functions ) • Unmodeled motions of the station • Monument instability • Loading of the crust by atmosphere, oceans, and surface water
Simple geometry for incidence of a direct and reflected signal Multipath contributions to observed phase for an antenna at heights (a) 0.15 m, (b) 0.6 m, and (c ) 1 m. [From Elosegui et al, 1995]
Left: Phase residuals versus elevation for Westford pillar, without (top) and with (bottom) microwave absorber. Right: Change in height estimate as a function of minimum elevation angle of observations; solid line is with the unmodified pillar, dashed with microwave absorber added [From Elosequi et al.,1995]
Top: PBO station near Lind, Washington. Bottom: BARD station CMBB at Columbia College, California
Modeling Errors in GPS Vertical Estimates • Signal propagation effects • Signal scattering ( antenna phase center/multipath ) • Atmospheric delay ( parameterization, mapping functions ) • Unmodeled motions of the station • Monument instability • Loading of the crust by atmosphere, oceans, and surface water
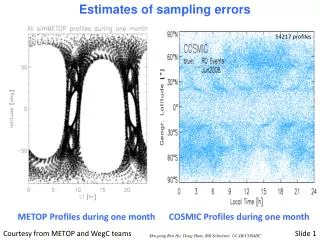
GPS adjustments to atmospheric zenith delay for 29 June, 2003; southern Vancouver Island (ALBH) and northern coastal California (ALEN). Estimates at 2-hr intervals.
Uncertainty in estimated height as function of minimum elevation angle observed (VLBI, from Davis [1986]; dotted line with no zenith delay estimated)
Correlation between estimates of height and zenith delay as function of minimum elevation angle observed (VLBI, from Davis [1986])
Percent difference (red) between hydrostatic and wet mapping functions for a high latitude (dav1) and mid-latitude site (nlib). Blue shows percentage of observations at each elevation angle. From Tregoning and Herring [2006].
Difference between a) surface pressure derived from “standard” sea level pressure and the mean surface pressure derived from the GPT model. b) station heights using the two sources of a priori pressure.c) Relation between a priori pressure differencesand height differences. Elevation-dependent weighting was used in the GPS analysis with a minimum elevation angle of 7 deg.
Height (red: simulated; black: estimated) and ZTD (green: simulated; blue: estimated) errors versus latitude as a function of error in surface pressure used to calculate the a priori ZHD. Uniform 10 mm data weighting applied.
Height (black/blue) and ZTD (red/green) errors at Davis, Antarctica, for different elevation cutoff angles as a function of error in surface pressure used to calculate the a priori ZHD.. Results shown for both elevation-dependent (blue and red results) and constant data weighting (black and green).
Modeling Errors in GPS Vertical Estimates • Signal propagation effects • Signal scattering ( antenna phase center/multipath ) • Atmospheric delay ( parameterization, mapping functions ) • Unmodeled motions of the station • Monument instability • Loading of the crust by atmosphere, oceans, and surface water
Modeling Errors in GPS Vertical Estimates • Signal propagation effects • Signal scattering ( antenna phase center/multipath ) • Atmospheric delay ( parameterization, mapping functions ) • Unmodeled motions of the station • Monument instability • Loading of the crust by atmosphere, oceans, and surface water
Atmosphere (purple) 2-5 mm Snow/water (blue) 2-10 mm Nontidal ocean (red) 2-3 mm Annual vertical loading effects on site coordinates From Dong et al. J. Geophys. Res., 107, 2075, 2002
Vertical (a) and north (b) displacements from pressure loading at a low-latitude site (S. Africa). Bottom is power spectrum. From Petrov and Boy (2004)
Vertical (a) and north (b) displacements from pressure loading at a mid-latitude site (Germany). Bottom is power spectrum.
Spatial and temporal autocorrelation of atmospheric pressure loading From Petrov and Boy, J. Geophys. Res.,109, B03405, 2004
Atmosphere (purple) 2-5 mm Snow/water (blue) 2-10 mm Nontidal ocean (red) 2-3 mm Annual vertical loading effects on site coordinates From Dong et al. J. Geophys. Res., 107, 2075, 2002
Differences in GPS estimates of ZTD at Algonquin, Ny Alessund, Wettzell and Westford computed using static or observed surface pressure to derive the a priori. (Elevation-dependent weighting used).
Station height estimates for Rio Grande, Argentina, using pressure from height-corrected STP, GPT and actual observations (MET). Dashed black line shows observed surface pressure; pink line shows atmospheric pressure loading deformation (corrected for in the GPS analyses) , offset by 2.07 m.