Download
1 / 59
590 likes | 596 Views
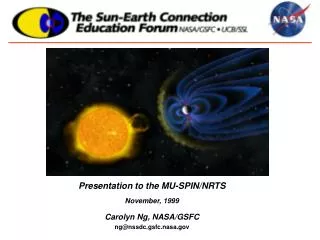
Image courtesy of NASA/GSFC. Global Climate Change: How We Got Here, and What Do We Do Now?. Eugene S. Takle Professor of Atmospheric Science Department of Geological and Atmospheric Sciences Professor of Agricultural Meteorology Department of Agronomy Director, Climate Science Initiative

E N D
Global Climate Change: How We Got Here, and What Do We Do Now? Eugene S. Takle Professor of Atmospheric Science Department of Geological and Atmospheric Sciences Professor of Agricultural Meteorology Department of Agronomy Director, Climate Science Initiative Iowa State University Ames, Iowa 50011 gstakle@iastate.edu Natural Resource Ecology and Management 120 Iowa State University 21 April 2008 CLIMATE SCIENCE INITIATIVE, IOWA STATE UNIVERSITY
Outline • Scientific basis for climate change • Why we are confident that the that humans are responsible for a large measure of the current warming • What do we do now? • What should you do? • What should ISU do? CLIMATE SCIENCE INITIATIVE, IOWA STATE UNIVERSITY CLIMATE SCIENCE INITIATIVE, IOWA STATE UNIVERITY
CO2, CH4 and temperature records from Antarctic ice core data Source:Vimeux, F., K.M. Cuffey, and Jouzel, J., 2002, "New insights into Southern Hemisphere temperature changes from Vostok ice cores using deuterium excess correction", Earth and Planetary Science Letters, 203, 829-843.
CO2, CH4 and temperature records from Antarctic ice core data Source:Vimeux, F., K.M. Cuffey, and Jouzel, J., 2002, "New insights into Southern Hemisphere temperature changes from Vostok ice cores using deuterium excess correction", Earth and Planetary Science Letters, 203, 829-843. Pattern repeats about every 100,000 years Natural cycles
Carbon Dioxide and Temperature 2007 380 ppm
Carbon Dioxide and Temperature 2050 550 ppm
Carbon Dioxide and Temperature “Business as Usual” 950 ppm
Carbon Dioxide and Temperature “Business as Usual” 950 ppm ?
http://www.ncdc.noaa.gov/img/climate/research/2006/ann/glob_jan-dec-error-bar_pg.gifhttp://www.ncdc.noaa.gov/img/climate/research/2006/ann/glob_jan-dec-error-bar_pg.gif
Source: IPCC, 2001: Climate Change 2001: The Scientific Basis
Source: IPCC, 2001: Climate Change 2001: The Scientific Basis
El Chichon (1982) Agung, 1963 Mt. Pinatubo (1991) At present trends the imbalance = 1 Watt/m2 in 2018 Hansen, Scientific American, March 2004
http://www.ncdc.noaa.gov/img/climate/research/2006/ann/glob_jan-dec-error-bar_pg.gifhttp://www.ncdc.noaa.gov/img/climate/research/2006/ann/glob_jan-dec-error-bar_pg.gif
Natural and anthropogenic contributions to global temperature change (Meehl et al., 2004). Observed values from Jones and Moberg 2001. Grey bands indicate 68% and 95% range derived from multiple simulations.
Natural and anthropogenic contributions to global temperature change (Meehl et al., 2004). Observed values from Jones and Moberg 2001. Grey bands indicate 68% and 95% range derived from multiple simulations. Natural cycles
Natural and anthropogenic contributions to global temperature change (Meehl et al., 2004). Observed values from Jones and Moberg 2001. Grey bands indicate 68% and 95% range derived from multiple simulations. Not Natural
Source: Jerry Meehl, National Center for Atmospheric Research
Energy intensive Reduced Consumption Energy conserving IPCC Fourth Assessment Report Summary for Policy Makers
Energy intensive Reduced Consumption Energy conserving The planet is committed to a warming over the next 50 years regardless of political decisions IPCC Fourth Assessment Report Summary for Policy Makers
Energy intensive Reduced Consumption Energy conserving Mitigation Possible Adaptation Necessary IPCC Fourth Assessment Report Summary for Policy Makers
Precipitation minus Evaporation for Western US (25N-40N, 95W-125 W) R. Seager, et al., 2007. Model Projections of an Imminent Transition to a More Arid Climate in Southwestern North America. Science, Vol. 316. no. 5828, pp. 1181 - 1184
Precipitation minus Evaporation for Western US (25N-40N, 95W-125 W) R. Seager, et al.,2007. Model Projections of an Imminent Transition to a More Arid Climate in Southwestern North America. Science, Vol. 316. no. 5828, pp. 1181 - 1184
Arctic Sea-Ice Extent Observed and Projected by Global Climate Models Meehl, G.A.,et al, 2007: Global Climate Projections. In: Climate Change 2007: The Physical Science Basis. Contribution of Working Group I to the Fourth Assessment Report of the Intergovernmental Panel on Climate Change [Solomon, S., D. Qin, M. Manning, Z. Chen, M. Marquis, K.B. Averyt, M. Tignor and H.L. Miller (eds.)]. Cambridge University Press, Cambridge, United Kingdom and New York, NY, USA. Chapter 10, p. 771
Arctic Sea-Ice Extent Observed and Projected by Global Climate Models Meehl, G.A.,et al, 2007: Global Climate Projections. In: Climate Change 2007: The Physical Science Basis. Contribution of Working Group I to the Fourth Assessment Report of the Intergovernmental Panel on Climate Change [Solomon, S., D. Qin, M. Manning, Z. Chen, M. Marquis, K.B. Averyt, M. Tignor and H.L. Miller (eds.)]. Cambridge University Press, Cambridge, United Kingdom and New York, NY, USA. Chapter 10, p. 771
Arctic Sea-Ice Extent Observed and Projected by Global Climate Models Meehl, G.A.,et al, 2007: Global Climate Projections. In: Climate Change 2007: The Physical Science Basis. Contribution of Working Group I to the Fourth Assessment Report of the Intergovernmental Panel on Climate Change [Solomon, S., D. Qin, M. Manning, Z. Chen, M. Marquis, K.B. Averyt, M. Tignor and H.L. Miller (eds.)]. Cambridge University Press, Cambridge, United Kingdom and New York, NY, USA. Chapter 10, p. 771
Arctic Sea-Ice Extent Observed and Projected by Global Climate Models 2005 Meehl, G.A.,et al, 2007: Global Climate Projections. In: Climate Change 2007: The Physical Science Basis. Contribution of Working Group I to the Fourth Assessment Report of the Intergovernmental Panel on Climate Change [Solomon, S., D. Qin, M. Manning, Z. Chen, M. Marquis, K.B. Averyt, M. Tignor and H.L. Miller (eds.)]. Cambridge University Press, Cambridge, United Kingdom and New York, NY, USA. Chapter 10, p. 771
Arctic Sea-Ice Extent Observed and Projected by Global Climate Models 2005 2007 Meehl, G.A.,et al, 2007: Global Climate Projections. In: Climate Change 2007: The Physical Science Basis. Contribution of Working Group I to the Fourth Assessment Report of the Intergovernmental Panel on Climate Change [Solomon, S., D. Qin, M. Manning, Z. Chen, M. Marquis, K.B. Averyt, M. Tignor and H.L. Miller (eds.)]. Cambridge University Press, Cambridge, United Kingdom and New York, NY, USA. Chapter 10, p. 771
Arctic Sea-Ice Extent Observed and Projected by Global Climate Models 2005 2007 Meehl, G.A.,et al, 2007: Global Climate Projections. In: Climate Change 2007: The Physical Science Basis. Contribution of Working Group I to the Fourth Assessment Report of the Intergovernmental Panel on Climate Change [Solomon, S., D. Qin, M. Manning, Z. Chen, M. Marquis, K.B. Averyt, M. Tignor and H.L. Miller (eds.)]. Cambridge University Press, Cambridge, United Kingdom and New York, NY, USA. Chapter 10, p. 771
Arctic Sea-Ice Extent Observed and Projected by Global Climate Models 2005 2007 Meehl, G.A.,et al, 2007: Global Climate Projections. In: Climate Change 2007: The Physical Science Basis. Contribution of Working Group I to the Fourth Assessment Report of the Intergovernmental Panel on Climate Change [Solomon, S., D. Qin, M. Manning, Z. Chen, M. Marquis, K.B. Averyt, M. Tignor and H.L. Miller (eds.)]. Cambridge University Press, Cambridge, United Kingdom and New York, NY, USA. Chapter 10, p. 771
Projected Changes for the Climate of Iowa/Midwest (My tentative assessment) • Longer frost-free period (high) • Higher average winter temperatures (high) • Fewer extreme cold temperatures in winter (high) • More extreme high temperatures in summer (medium) • Higher nighttime temperatures both summer and winter (high) • More (~10%) precipitation (medium) • More variability of summer precipitation (high) • More intense rain events and hence more runoff (high) • Higher episodic streamflow (medium) • Longer periods without rain (medium) • Higher absolute humidity (high) • Stronger storm systems (medium) • Reduced annual mean wind speeds (medium) Follows trend of last 25 years and projected by modelsNo current trend but model suggestion or current trend but models inconclusive
What To Do Now • Mitigation • Become active politically • National level - examine candidate platforms • Demand that state and local organizations examine carbon emissions • Examine personal choices • Home energy use • Auto type and use • Purchase of “stuff”
What To Do Now • Mitigation • Become active politically • National level - examine candidate platforms • Demand that state and local organizations examine carbon emissions • Examine personal choices • Home energy use • Auto type and use • Purchase of “stuff” • Adaptation • Stay informed of the best science on climate change for the Midwest • Encourage public and private investment in sustainable and resilient practices and infrastructure
What To Do Now • Mitigation • Become active politically • National level - examine candidate platforms • Demand that state and local organizations examine carbon emissions • Examine personal choices • Home energy use • Auto type and use • Purchase of “stuff” • Adaptation • Stay informed of the best science on climate change for the Midwest • Encourage public and private investment in sustainable and resilient practices and infrastructure • Consider preparing for a career relating to problems of climate change
What To Do Now • North American Regional Climate Change Assessment Program • ISU Climate Science Initiative • Midwest Consortium for Climate Assessment (MiCCA) (proposed to NOAA) CLIMATE SCIENCE INITIATIVE, IOWA STATE UNIVERSITY CLIMATE SCIENCE INITIATIVE, IOWA STATE UNIVERITY