Download
1 / 29
300 likes | 401 Views
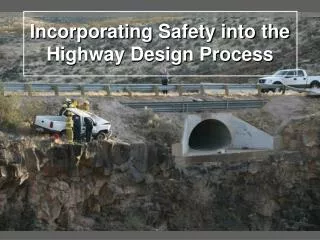
Incorporating Safety into the Transportation Planning Process. 62 nd Illinois Traffic Engineering and Safety Conference October 23, 2013. Traffic Safety.

E N D
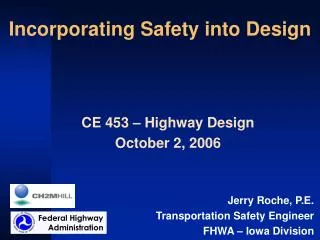
Incorporating Safety into the Transportation Planning Process 62nd Illinois Traffic Engineering and Safety Conference October 23, 2013
Traffic Safety • Traffic safety is one of the most important characteristics of transportation system performance. Therefore, one would expect that safety is well integrated into all aspects of an agency’s planning and decision-making processes. However, in many instances, such is not the case. • A comprehensive and effective consideration of safety in transportation-planning would result in traffic safety improvements for the region.
CUUATS Integration of Safety into the Planning Process • The purpose of this presentation is to provide overall direction on how safety is integrated into the CUUATS transportation-planning process.
CUUATS’ Safety Approach • Integrate safety into all aspects of the transportation planning process. • Identify safety as a major LRTP goal and be committed to safety. • Define specific objectives & performance measures & strategies to achieve safety goals. • As an MPO, assist local member agencies addressing their highway safety problems & needs.
CUUATS’ Safety Approach • Use current technologies (e.g., GIS) to provide timely & accurate information, especially in the areas of data collection and analysis. • Develop community-based traffic safety programs. • Create a safety committee. This committee helps to ensure the timeliness, accuracy, and linkage of data and help to avoid duplication of efforts. • Develop a comprehensive safety program that includes a range of strategies & actions & involves different agencies & groups.
CUUATS Transportation Planning Process (Safety) Geometric Features IDOT Crash Records Traffic Counts Engineering Education Long Term Safety Recommendations Preferred Scenario Enforcement EMS LRTP Goals Performance Measures LRTP Mission LRTP Objectives Data Analysis Proposed Strategies Planning Crash Analysis, Network Screening, etc. HSIP TIP Evaluation Implementation Operations
Long Range Transportation Plan 2035:Mission Statement • LRTP 2035 Mission: • To provide a safe, efficient, and economical transportation system that makes the best use of existing infrastructure, optimizes mobility, promotes environmental sensitivity, sustainability, accessibility, economic development, and enhances quality of life for all users.
Long Range Transportation Plan 2035:Goals • SAFETEA-LU/MAP-21 Planning Factor #2 • Increase the safety of the transportation system for motorized and non-motorized users • Goal 3: • Transportation modes and facilities in the urbanized area will be safe for all users
Long Range Transportation Plan 2035:Objectives & Performance Measures • Objective: • Reduce the total number of crashes in Champaign-Urbana by 5% by 2014 • Performance Measure: • Total Crashes per 100M VMT • Objective: • Reduce the total number of fatalities and severe injuries in Champaign-Urbana by 25% between 2009 and 2014 • Performance Measures: • Total Fatalities per 100M VMT • Total Severe Injuries per 100M VMT
Long Range Transportation Plan 2035:Objectives & Performance Measures • Objective: • Reduce the total number of crashes involving bicyclists and pedestrians in Champaign-Urbana by 15% by 2014 • Performance Measures: • Total Pedestrian Crashes • Total Bicycle Crashes
Suggestions for deciding about performance measures • Review safety-related performance measures used by similar agencies in the U.S. • Prepare a list of typical safety-related performance measures that reflect the goals & objectives defined in your planning effort. • Discuss the proposed performance measures with those in the agency responsible for collecting the data to ensure feasibility of collection and data accuracy.
Data Analysis • Effective data analysis relies on the availability and use of accurate/reliable data. • Data analysis is also important for identifying “hot spots” for traffic safety.
Tools for Data Analysis • Inventory the types of safety analysis tools that exist in the state or metropolitan area’s safety-related agencies. • Develop a long term and coordinated data-collection and safety analysis strategy for the metropolitan area. • Use crash reduction factors and their associated reductions in crashes & fatalities for different types of safety improvements.
Total Crashes per 100 MVMT LTRP 2035 Objective: Reduce the total number of crashes in Champaign- Urbana by 5% by 2014. Performance Measure: Total crashes per 100 M VMT Data Analysis: The total number of crashes decreased 10.3% from 2,264 in 2009 to 2,030 in 2011 and crash rates declined 8.3% in the same period. The VMT in the region decreased 2.2% between 2009 and 2011. Performance Measure Results: Positive rating due to the 8.3 % reduction in total crashes per 100 M VMT since 2009. This is 3.3% higher than the target of 5% decrease in crashes in the urbanized area by 2014. VMT and Total Crash Rates in Champaign-Urbana Total Crashes per 100 Million VMT
Fatalities per 100 Million VMT LRTP 2035 Objective: Reduce the number of fatalities in Champaign-Urbana by 25% between 2009 and 2014. Performance Measure: Total fatalities per 100 M VMT. Data Analysis: Number of fatalities in the urbanized area dropped from 8 in 2008 to 4 in 2009 but increase back to 6 in 2011. Performance Measure Results: Negative rating for year 2011 because the fatalities per 100 M VMT increased from 0.45 in 2009 to 0.69 in 2011. Traffic Fatalities per 100 Million VMT Traffic Fatalities in Champaign-Urbana
Corridor Analysis Crashes along Major Corridors in Champaign-Urbana
Tools for Data Analysis • For non-infrastructure or non-traffic operations strategies, such as safety education, marketing campaigns, & emergency management services, work closely with safety partner organizations to determine a methodology for assessing the effectiveness of such strategies. This might include targeted before and after studies on selected programs.
Evaluation • Most safety-related evaluation efforts use one of three methods: • Listing the evaluation criteria and show how the alternatives compare • Assigning weights or scores to the evaluation factors • Conducting cost-benefit analysis
HSIP ApplicationCounty Road 1 Listing the evaluation criteria and show how the alternatives compare Proposed Mitigation Measures
CUUATS Project Assessment Guidelines for TIP 2. Assigning weights or scores to the evaluation factors
HSIP ApplicationCounty Road 1 3. Conducting cost-benefit analysis B/C 8.00
Plan and Program Development Strategies included in the LRTP and UTWP • Produce the Selected Crash Intersection Locations (SCIL) report every two years • Evaluate intersections that have problematic or crash-inducing patterns and identify solutions • Improve visibility for all roadway users through improved lighting, striping, signage, visibility triangles, and access control
Plan and Program Development • Continue educational programs for CUUATS member agencies as well as law enforcement officers about safety issues • Continue educational programs for grades K-12 including driver’s education and safety programs such as Operation Cool • Continue educational safety programs for the community including drivers, bicyclists & pedestrians
System Monitoring • LRTP 2035 Report Card • Monticello Road HSIP Project: Before and After Crash Severity: Before and After Collision Type Distribution: Before and After