Download
1 / 8
80 likes | 317 Views
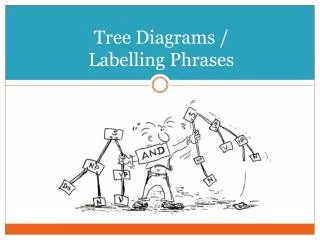
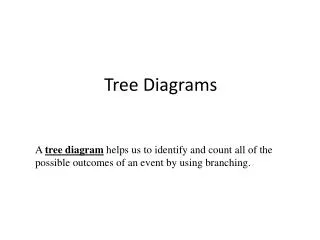
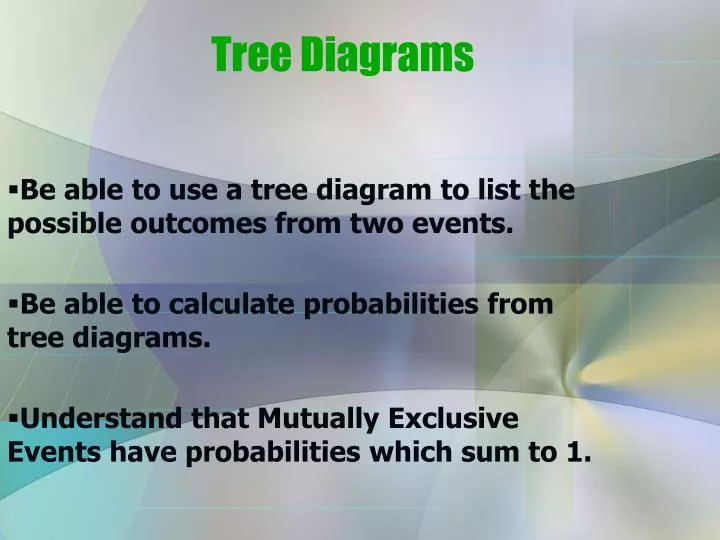
Tree Diagrams. Be able to use a tree diagram to list the possible outcomes from two events. Be able to calculate probabilities from tree diagrams. Understand that Mutually Exclusive Events have probabilities which sum to 1.

E N D
Tree Diagrams Be able to use a tree diagram to list the possible outcomes from two events. Be able to calculate probabilities from tree diagrams. Understand that Mutually Exclusive Events have probabilities which sum to 1.
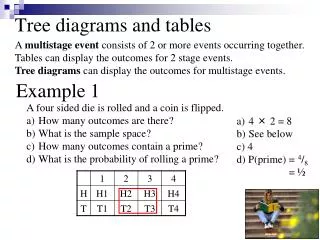
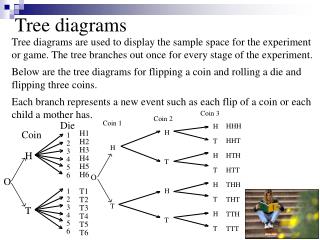
The probability that it will rain on Monday is 0.2. The Probability it will rain on Tuesday is 0.3. • What is the probability that it will rain on Monday and Tuesday?
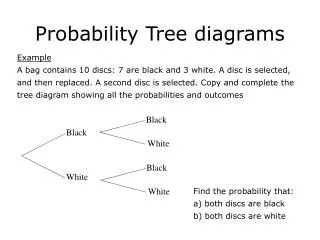
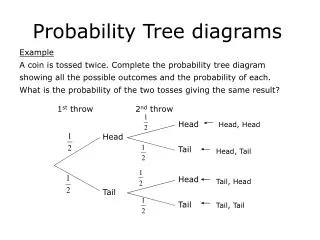
Look! Vertically, the numbers add up to 1. Look! Vertically, the numbers add up to 1. Look! Vertically, the numbers add up to 1. Tuesday It rains • We can solve this problem by drawing a tree diagram. 0.3 Monday We know that the probability is 0.2 It rains 0.2 There are two possible events here; It rains or It does not rain 0.7 It does not rain Now let’s look at Tuesday The probability that it rains on Tuesday was given to us as 0.3. We can work out that the probability of it not raining has to be 0.7, because they have to add up to 1. It rains 0.3 0.8 It does not rain Well, raining and not raining are Mutually Exclusive Events. So their probabilities have to add up to 1. What is the probability? 1 – 0.2 = 0.8 We now have the required Tree Diagram. 0.7 It does not rain
Tuesday It rains 0.3 Monday It rains 0.2 0.7 It does not rain It rains 0.3 0.8 It does not rain 0.7 It does not rain We wanted to know the probability that it rained on Monday and Tuesday. 0.2 x 0.3 = 0.06 We can work out the probability of both events happening by multiplying the individual probabilities together This is the only path through the tree which gives us rain on both days So the probability that it rains on Monday and Tuesday is 0.06
Tuesday It rains 0.3 Monday It rains 0.2 0.7 It does not rain It rains 0.3 0.8 It does not rain 0.7 It does not rain Actually, we can work out the probabilities of all the possible events 0.2 x 0.7 = 0.14 The probability of rain on Monday, but no rain on Tuesday is 0.14
Tuesday It rains 0.3 Monday It rains 0.2 0.7 It does not rain It rains 0.3 0.8 It does not rain 0.7 It does not rain 0.8 x 0.3 = 0.24 The probability that it will not rain on Monday, but will rain on Tuesday is 0.24
Tuesday It rains 0.3 Monday It rains 0.2 0.7 It does not rain It rains 0.3 0.8 It does not rain 0.7 It does not rain 0.8 x 0.7 = 0.56 The probability that it does not rain on both days is 0.56
Tuesday It rains 0.3 Monday 0.06 It rains 0.2 0.7 0.14 It does not rain 0.24 It rains 0.3 0.8 It does not rain 0.56 0.7 It does not rain Let’s look at the completed tree diagram The end probabilities add up to 1. Remember this! It can help you check your answer! What do you notice?