Download
1 / 27
280 likes | 451 Views
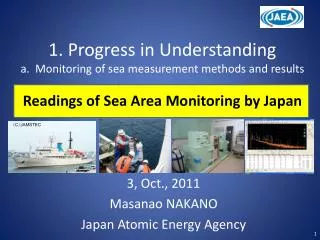
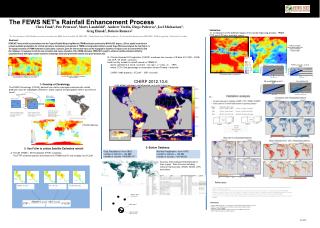
Current state of the marine environment in the Pacific Ocean 1 . Radioactivity in seawater and marine soil by Japanese monitoring in 2012 2. Simulation of marine dispersion in the Pacific Ocean. 15.Oct. 2012 Masanao NAKANO Japan Atomic Energy Agency.

E N D
Current state of the marine environment in the Pacific Ocean1. Radioactivity in seawater and marine soil by Japanese monitoring in 20122. Simulation of marine dispersion in the Pacific Ocean 15.Oct.2012 Masanao NAKANO JapanAtomic Energy Agency
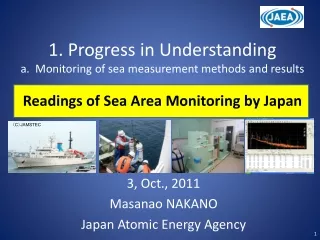
1. Radioactivity in seawater and marine soil by Japanese monitoring in 2012
Basic concept of the revision of the monitoring plan is to ascertain (1) concentration levels mainly for ceasium-134,137 in seawater by enhancing the analysis accuracy, (2) the spatial distribution and chronological movement of radioactive materials in marine soiland characteristics of marine soil, (3) the chronological changes in radioactivity concentrations in fishery products with regard to marine organisms. Furthermore, the monitoring content will be enhanced and strengthened by taking into account not only the routes of radioactive materials discharged into the sea from TEPCO’s Fukushima Dai-ichi NPP but also those of radioactive materials flowing into the sea from the land area via rivers. When conducting the sea area monitoring, attention will also be paid to the viewpoints of helping the understanding of the movement of radioactive materials from the environment to marine organisms and the bioconcentration process. Sea Area Monitoring Plan in FY2012 http://radioactivity.mext.go.jp/en/contents/5000/4854/view.html
(i) Sea area close to TEPCO’s Fukushima Dai-ichi NPP: The area near the 1F-NPP requiring close watch (ii) Coastal area: The area within about 30km from the coastline of Aomori (only partially), Iwate to Miyagi, Fukushima and Ibaraki prefectures (including river outlets) (iii) Off-shore area: The area within about 30 to 90 km from the coastline (iv) Outer sea area: The area within about 90 to 280 km and 280 km or farther from the coastline (v) Tokyo Bay: The closed sea area where radioactive materials are highly likely to flow in from rivers and be deposited in particular Five sea areas (ii) (iii) (i) (iv) (v) http://radioactivity.mext.go.jp/en/contents/5000/4854/view.html
In area(i), high frequency (dairy) monitoring with the aim of checking any new leakage of radioactive materials from the NPP with detection limit(DL) at 1 Bq/L. TEPCO will be in charge of this monitoring. In areas (ii)-(v), monitoring by lowering detection limits according to sea areas for the purpose of scientifically ascertaining long-term effects with DL at 1 mBq/L. Mainly MEXT will be in charge of this monitoring. Main objective nuclides are Cs-134,137, but sometimes H-3, Sr-89,90, I-131, Pu-238,239,240 etc. will be analyzed. Seawater * http://radioactivity.mext.go.jp/en/contents/5000/4854/view.html
Measuring points will be determined by taking into consideration river outlets and fishing grounds in order to understand the flow and movement of radioactive materials into the sea via rivers. In area(i) and part of (ii), monthly measurement for I-131 and Cs-134,137 are conducted with DL at 10 Bq/kg. The other areas except (iv), lower frequency measurement are conducted with DL at 1 Bq/kg . Marine soil * http://radioactivity.mext.go.jp/en/contents/5000/4854/view.html
Seawater in area (i)* (Bq/L) Northern Side of the Water Discharge Canal of 5 and 6 1,000,000 100,000 10,000 1,000 100 10 1 0.1 2011 2012 :I-131 :Cs-134 :Cs-137 :I-131 :Cs-134 :Cs-137 Max:68,000Bq/L(2011.4.7) 1~10Bq/L 3 4 5 6 7 8 9 10 11 12 1 23 45678 (Bq/L) Iwasawacoast (15km south of 1F-NPP) 10,000 1,000 100 10 1 0.1 2011 2012 Max:1,400Bq/L(2011.4.5) 0.1~1Bq/L 3 4 5 6 7 8 9 10 11 12 1 23 45678 BG level for 137Cs before the accident=0.001~0.002 Bq/L * http://www.tepco.co.jp/en/nu/fukushima-np/f1/index9-e.html
Seawater in area (ii) (Bq/L) 0.05> 0.01~0.05 <0.01 (Bq/L) river 20km In Fukushima prefecture, North < South But less than 0.1 Bq/L river http://radioactivity.mext.go.jp/ja/contents/7000/6107/24/229_m_0831.pdf http://radioactivity.mext.go.jp/ja/contents/7000/6069/24/229_F_0727_0827.pdf http://radioactivity.mext.go.jp/ja/contents/6000/5979/24/229_3_120815.pdf
Seawater in area (iii) (Bq/L) 0.05> 0.01~0.05 <0.01 (Bq/L) Miyagi In 3 prefectures, North < South Less than 0.1 Bq/L Deep sea Fukushima (Bq/L) Ibaraki Cs-137=BG level Cs-134=1/10 of Cs-137 http://radioactivity.mext.go.jp/ja/contents/6000/5876/24/229_mhic_0731.pdf
Trend of seawater in area (iii) Concentration of Cs-137 had been decreasing till last September. But since then, unchanged in Miyagi and Fukushima, Fluctuated in Ibaraki,depending on desorption from marine soil? Inflow from river? Release from NPP? Miyagi (M-A1 O) Surface Middle Lower Fukushima (M-E1 O) Cs-137 concentration (Bq/L) Ibaraki (M-I1 O) May,2012 http://www.mext.go.jp/b_menu/shingi/chousa/gijyutu/019/shiryo/__icsFiles/afieldfile/2012/08/07/1324368_6_1.pdf (in Japanese) http://radioactivity.mext.go.jp/ja/contents/6000/5876/24/229_mhic_0731.pdf
90-280km Seawater in area (iv) Oyashio region Maximum: 100m depth Nov.2011 May.2012 0.05> 0.01~0.05 <0.01 (Bq/L) Oyashio May.2012 Kuroshio region Maximum: unclear Kuroshio (Warm ) Oyashio (Cold ) 134, 137Cs Kuroshio http://radioactivity.mext.go.jp/ja/contents/4000/3806/24/1330_012414.pdf http://radioactivity.mext.go.jp/ja/contents/7000/6124/24/229_mfic_0903.pdf May.2012
280km~ Seawater in area (iv) (Bq/L) 0.05> 0.01~0.05 <0.01 Oxygen maximum By Aoyama, MRI In May 2012:Less than 0.01 Bq/L Surface seawater Oct 2011: 0.025 Bq/L June 2012: 0.001Bq/L http://radioactivity.mext.go.jp/ja/contents/6000/5889/24/229_g_0802.pdf http://www.mri-jma.go.jp/Topics/hotyouhi/houtyouhi_sea.html (in Japanese)
134Cs in surface water in Jan. – Mar. 2012 Data sources: MEXT monitoring, Aoyama this study Solid circle with color: observed dataunit: Bq m-3 0.01Bq/L =10 Bq m-3 Aoyama, unpublished
Eastward movement of observed Fukushima origin 134Cs in surface water during the period from March 2011 to July 2012 Estimated speed :8 cm s-1 1800km (140E->160E) 270 days This is consistent with 4-16 cm s-1 Days since 1 March 2011 150 E 150W Aoyama, unpublished
More data in area (iv) in near future Seawater samples collected during June 2012 by MRI are analyzing now. Only data from two stations at 39 deg.N and 35 deg. N along 165 deg. E are available. http://radioactivity.mext.go.jp/en/contents/5000/4854/view.html
Marine soil in area (i)(ii) >1000 100~1000 10~100 <10 (Bq/kg) Northern Side of the Water Discharge Canal of 5 and 6 (Bq/kg) 20km 30km 1E6 1E5 1E4 1000 100 10 1 2011 2012 (Bq/kg) BG:0.8~1.4 7 8 9 10 11 12 1 2 3 4 5 6 7 8 http://radioactivity.mext.go.jp/ja/contents/7000/6108/24/229_kando_0831.pdf http://www.tepco.co.jp/nu/fukushima-np/f1/index9-j.html
Marine soil in area (iii) (Bq/kg) >1000 100~1000 10~100 <10 (Bq/kg) The concentration in marine soil varied widely, if taken at the same places. http://www.mext.go.jp/b_menu/shingi/chousa/gijyutu/019/shiryo/__icsFiles/afieldfile/2012/08/07/1324368_6_1.pdf (in Japanese) http://radioactivity.mext.go.jp/ja/contents/6000/5703/24/229_so_0710.pdf
Current state of Cs-137 in seawater and marine soil in 2012 (ii) (iii) (i) (iv) (v) * http://www.kaiseiken.or.jp/publish/itaku/rep2011.pdf(in Japanese)
Near 1F NPP Seawater: ND~0.15(Bq/L), 100 times of BG(0.001), 0.1 time of 137Cs Marine soil: ND~3.4(Bq/kg), 100 times of BG(0.03), 0.001 time of 137Cs The ratio of 90Sr/137Cs was increasing, because of leakage of processed(Cs-removed) reactor water? Sr-90 in seawater and marine soil (Povinec at al., 2012) PavelP. Povinec et al., Radiostrontium in the Western North Pacific : Characteristics, Behavior and the Fukushima Impact, Environ. Sci. Technol., Just Accepted Manuscript, DOI: 10.1021/es301997c, (2012)
Re-simulation by LAMER EU meeting in 2011 (Nakano and Povinec, 2012) 15*0.5+(0.94+0.0096)=8.45PBq 2PBq(outside of map) 8.45PBq(direct) 6PBq(deposition to ground) 4PBq(direct) 5PBq(deposition to sea) EU meeting now Kawamura et al. (2011) Nakano and Povinec, Long-term simulations of the 137Cs dispersion from the Fukushima accident in the world ocean, Journal of Environmental Radioactivity 111, 109-115,(2012) Kawamura et al., Preliminary Numerical Experiments on Oceanic Dispersion of 131I and 137Cs Discharged into the Ocean because of the Fukushima Daiichi Nuclear Power Plant Disaster, Journal of NUCLEAR SCIENCE and TECHNOLOGY, Vol. 48, No. 11, p. 1349–1356 (2011)
Re-simulation by LAMER (Nakano and Povinec, 2012) • Almost same movement with the previous calculation with the preliminary source term • Maximum concentration of Cs-137 in April 2012 was calculated as 21 Bq/m3 (=0.021 Bq/L) at 38N, 164E. (23 Bq/m3 by the previous calculation)
Comparison with the observed concentration in seawater expand 1mBq/L was reduced as BG contribution Comparison of Cs-137 concentration in seawater outside 200 nautical mile line (= 370km) due to Fukushima accident (BG(0.001) was reduced.) Nakano, unpublished
Simulated Cs-137 concentration in fish outside 200 nautical mile line Simulated max concentration in fish at equilibrium at time(t) = Cw(t)*CF(fish) Cw(t): simulated maximum concentration in seawater CF(fish):concentration factor of fish (=100) If you take 64-g fish of this concentration (2 Bq/kg) everyday, you will receive 0.62μSv/a from 137Cs and 0.80μSv/a from 134Cs . Nakano, unpublished The observed data was extracted from the website of “http://www.jfa.maff.go.jp/e/inspection/index.html”
Dose assessment in 2012-2014 • Internal exposure by the intake of the marine products in 2012 would be 1.67 micro Svper year mainly from 134+137Cs in fish, when adopting the maximum concentration and the averaged Japanese diet. • Internal exposure in 2013 and 2014 would be 0.74 and 0.41 micro Svper year, respectively. • Because the dose is proportional to the consumption amount of sea food, most public in the world will get lower doses than the Japanese population. 25
26 134Cs in surface water By Aoyama (unpublished) Data sources: NYK ships, Inoue et al., MEXT, Hakuho Solid circle with color: observed data Pattern: Atmospheric model with ocean model simulation Source term Chino et al. 8.8 PBq for atmospheric release and Tsumune et al., 3.5 PBq for direct discharge unit: Bq m-3 in Oct. – Dec. 2011 in Apr – June 2011 in July – Sept. 2011 in Jan. – Mar. 2012
The concentration of 134,137Cs in seawater near 1F-NPP was considerably decreased to 1~10Bq/L in 2012, which is 1,000-10,000 times of BG level. The concentration of 134,137Cs in the deep Pacific is BG~0.01 Bq/L, which is 10 times of BG level. The simulation by LAMER estimated the concentrations of 137Cs in seawater and marine products. The result agrees the observation of them. The internal dose from Japanese consumption of all marine product was estimated to be 1.7, 0.74 and 0.41 micro Sv/a in 2012, 2013 and 2014, respectively. Conclusion