Download
1 / 8
90 likes | 151 Views
An important part of Business Intelligence, data visualization is an overall term that describes the efforts of placing data in a visual context, to make it easily comprehendible for people and organizations.

E N D
Introduction An Important part of Business Intelligence, data visualization is an overall term that describes the efforts of placing data in a visual context, to make it easily comprehendible for people and organizations. A number of data visualization software solutions allow for building data into patterns, correlations, and trends, for good utilization that might otherwise go undetected in text-based data. Equally important is the score-carding and monitoring of events and metrics, something which a solution like IBM Cognos enables an organization to do.
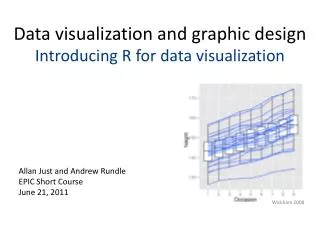
Modern Forms of Data Visualization Modern data visualization tools go beyond charts and graphs made in Excel spreadsheets. These may include tools for data display in more sophisticated ways that increase interaction capabilities, enabling users to drill and manipulate the data for analysis. Info-graphics Geographic maps Dials and gauges Spark lines Heat maps Bar, pie, and fever charts
Need for Business Intelligence and Data Visualization Software Data visualization and business intelligence tools can be used in order to make better decisions about your company’s future. While most business intelligence software providers embed data visualization into their products, they can either be developing the technology themselves or sourcing it from firms that specialize in visualization software. You should, therefore, be aware about your needs before employing business intelligence software for your company.
What can a Data Visualization Software do? Data Visualization with business intelligence gives you the best of both worlds – accurate and consistent analytics that can be relied on, along with the ease-of-use and the rapidity required to alter it. Good data visualization software can help you in the following ways: Easy uploading of data for a compelling analysis Rich and interactive visuals will help you share inclusive insights Fluid assessment of data, along with quick answers anytime Creating intelligent data integrations from multiple sources
More Benefits of the Software Apart from giving visual insights and better accessibility than Excel, contemporary data visualization and business intelligence tools let you make better decisions by offering: Quick response times Intuitive UI DIY dashboards Big Data analysis Mobile collaboration
Data Visualization and Business Intelligence Solutions by Saturn Business Systems Saturn Business Systems provides a complete suite of business intelligence data visualization solutions, in partnership with a number of industry leaders. Their solutions can help transform your business’s analytics and decision making capabilities.