Download
1 / 26
260 likes | 266 Views
Hispanic Avocado Shopper Insights. 2018 Hispanic Study Part 2. A demographic view of the Hispanic and Non-Hispanic avocado shopper. Objective and Methodology. Objective

E N D
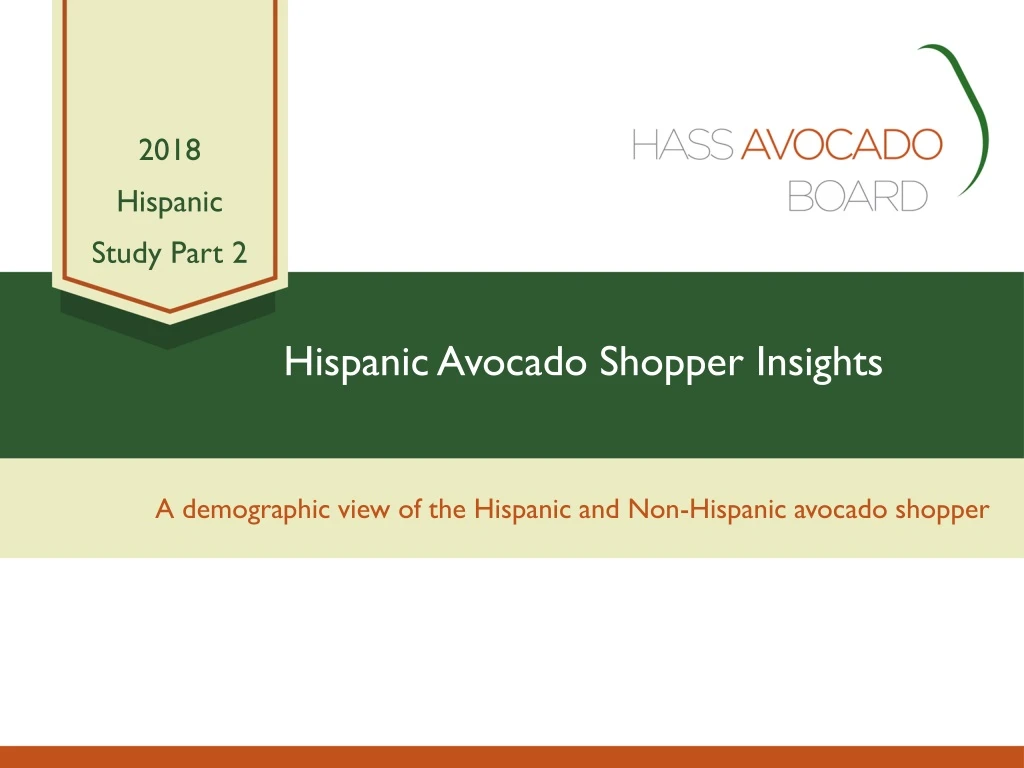
Hispanic Avocado Shopper Insights 2018 Hispanic Study Part 2 A demographic view of the Hispanic and Non-Hispanic avocado shopper
Objective and Methodology Objective Uncover insights into Hispanic avocado shoppers based on their key demographic variables and how these variables may be influencing the differing avocado purchase trends of Hispanic (and Non-Hispanic) avocados shoppers. Methodology Part 1 of the 2018 Hispanic study* revealed that Hispanic households were more highly engaged in the avocado category across a number of key purchase metrics compared to Non-Hispanic households. Part 2 of the study compares key demographic variables of Hispanic and Non-Hispanic households to discern how the demographic make-up of these two groups may be contributing to their differing purchase dynamics. This study also drills into the demographic profiles of the four purchase level segments (Super, Heavy, Medium and Light) for both Hispanic and Non-Hispanic avocado households to further understand the role demographics may be playing in current and future avocado purchase trends. For more information on terms, demographic variable definitions and shopper segmentation methodology, see the Appendix. *For more information on the avocado purchase trends of Hispanic and Non-Hispanic households, see part 1 of the Hispanic Avocado Shopper Trends Study on hassavocadoboard.com
Executive Summary FACT: Hispanic households are more engaged in the avocado category, averaging a +45% higher spend per household on avocados than Non-Hispanic households. INSIGHT: 5 of the 6 demographic variables studied are likely contributors to this heavier engagement. • Starting on slide 8, get an in-depth look at each of the 6 demographic variables *For more information on the avocado purchase trends of Hispanic and Non-Hispanic households, see part 1 of the Hispanic Avocado Shopper Trends Study on hassavocadoboard.com Data Source: IRI Consumer NetworkTM 2017 vs. 2016 (All figures are rounded)
Executive Summary Executive Summary Hispanic households are highly engaged in the avocado category, displaying avocado purchase trends that surpass those of Non-Hispanic households. Notably, nearly three out of four Hispanic households purchased avocados last year compared to less than half of Non-Hispanic households. Moreover, the average annual avocado spend per Hispanic household is +45% greater than that of their Non-Hispanic counterparts. This study found that, underlying these dynamics, are distinct Hispanic and Non-Hispanic demographic profiles that may be contributing to these differences. One of the demographic variables of note is household size. Hispanic households tend to be larger than Non-Hispanic households. For example, 62% of Hispanic households have 3 or more occupants compared to only 41% of Non-Hispanic households. Larger households may be a key driver of the higher Hispanic household spend rate, as these larger households account for the majority (64%) of all Hispanic household avocado purchases. Contributing to the larger Hispanic households is the greater presence of children: half of Hispanic households have children compared to one-third of Non-Hispanic households. Also, 78% of Hispanic heads of household are married compared to 65% of Non-Hispanic heads of household. Continued on next page… Data Source: IRI Consumer NetworkTM 2017 (All figures are rounded)
Executive Summary Age is another factor that sets Hispanic households apart. Hispanic households tend to be younger than Non-Hispanic households. The youngest age group (18 to 34) is the largest, comprising 30.7% of Hispanic households. In contrast, this same age group makes up only 20.4% of Non-Hispanic households. At the other end of the age spectrum, the 55+ group accounts for only 22.7% of Hispanic households, while comprising 43.8% of Non-Hispanic households. Age, marital status, presence of children and household size are demographic variables that clearly distinguish Hispanic households from Non-Hispanic households and may help drive the higher Hispanic avocado purchase trends. Another demographic variable looks at whether households are located in high-population areas or low-population areas, with “A” counties representing the metropolitan areas of the 25 largest U.S. cities (based on population). A larger proportion of Hispanic households (55.5%) are located in “A” counties compared to only 42.0% of Non-Hispanic households. Major cities are often associated with higher household incomes, but this study found that despite the greater concentration of Hispanic households in “A” counties, higher income households ($70,000+) make up a smaller share of Hispanic households (41.7%) than they do of Non-Hispanic households (45.9%). Full study results follow, with more information including detailed demographic profiles for each of the purchase level segments (Super, Heavy, Medium and Light). Data Source: IRI Consumer NetworkTM 2017 (All figures are rounded)
All Households & Shopper segments Hispanic and Non-Hispanic Avocado-purchasing Household demographics
Hispanic households have greater involvement in the avocado category than Non-Hispanic households. What can demographics tell us about these differences? Household Penetration Spend per Household +25.4 pts. +45% Higher! Nearly 75% of Hispanic households purchased avocados in 2017, while less than half (47.9%) of Non-Hispanic households purchased avocados during the same period. Moreover, the average annual avocado spend per household was +45% higher for Hispanic avocado households ($33.01) than for Non-Hispanic avocado households ($22.69). *For more information on the avocado purchase trends of Hispanic and Non-Hispanic households, see part 1 of the Hispanic Avocado Shopper Trends Study on hassavocadoboard.com Data Source: IRI Consumer NetworkTM 2017 vs. 2016 (All figures are rounded)
Hispanic households tend to be larger (3+ occupants) than Non-Hispanic households HH Size Households with 3+ occupants 62.0% of Hispanic households have 3 or more occupants, compared to 41.1% of Non-Hispanic households. • This +21-point gap may be a factor in the higher average Hispanic avocado spend per household (prior page) This same pattern applies for every segment (S, H, M, L), with 3+ householdscomprising approximately 60% of total Hispanic households compared to 44.3% or less for each of the Non-Hispanic segments (S, H, M, L). Non-Hispanic Households Hispanic Households +21 pts. Higher -0.2 pts. vs. py +0.1 pt. vs. py 1 2 3 4 5+ 44.2% 43.8% 40.0% 36.7% 63.1% 61.7% 63.6% 57.8% Data Source: IRI Consumer NetworkTM 2017 vs. 2016 (All figures are rounded). See slide 21 for shopper segmentation methodology
Larger (3+) households account for a greater share of avocado purchases in Hispanic households than in Non-Hispanic households HH Size Avocado Purchases - Households with 3+ occupants Hispanic households with 3+ occupants make 63.6% of Hispanic avocado purchases: a +19.8 point gap vs. Non-Hispanic households. • This is also the case for all segments (S, H, M, L), with 3+ Hispanic households accounting for approximately 60% of Hispanic household avocado purchases The opposite trend is seen in Non-Hispanic households. One and two-person households account for the majority (56.2%) of Non-Hispanic household avocado purchases. • This pattern is the same for all segments (S, H, M, L), with one and 2-person households accounting for 55.8% to 62.3% of Non-Hispanic household avocado purchases Non-Hispanic Households Hispanic Households +20 pts. Higher -3.1 pts. vs. py +0.1 pt. vs. py 1 2 3 4 5+ 44.2% 43.9% 40.2% 37.7% 64.1% 61.3% 63.3% 58.8% Data Source: IRI Consumer NetworkTM 2017 vs. 2016 (All figures are rounded). See slide 21 for shopper segmentation methodology
A greater proportion of Hispanic heads of household are married Married Households with Married Occupants 77.5% of Hispanic heads of household are married, a +12.3 point gap vs. Non-Hispanic households (65.2%). • Across all four segments (S, H, M, L), 74.5% or more Hispanic household heads are married For Non-Hispanic households, the proportion of married household heads is lower overall (65.2%) and varies more by segment (S, H, M, L), ranging from 61.3% to 69.5%. Non-Hispanic Households Hispanic Households +12 pts. Higher +0.5 pt. vs. py -0.4 pt. vs. py Other* Single Married *Other = Divorced, Widowed or Separated Data Source: IRI Consumer NetworkTM 2017 vs. 2016 (All figures are rounded). See Slide 21 for shopper segmentation methodology
Hispanic households with married household heads account for 78.6% of all Hispanic avocado purchases Married Avocado Purchases - Households with Married Occupants Hispanic households with married household heads make 78.6% of Hispanic avocado purchases, a +10.1 point gap vs. Non-Hispanic households (68.5%). • At every segment (S, H, M, L), Hispanic households with married household heads make 74.9% or more avocado purchases Non-Hispanic households with married household heads account for less than 70% of total Non-Hispanic avocado purchases and less than 70% at each of the individual segments (S, H, M, L). Non-Hispanic Households Hispanic Households +10 pts. Higher -1.0 pt. vs. py -1.8 pts. vs. py Other* Single Married *Other = Divorced, Widowed or Separated Data Source: IRI Consumer NetworkTM 2017 vs. 2016 (All figures are rounded). See Slide 21 for shopper segmentation methodology
A greater proportion of Hispanic households also have children Children Households with Children Half (50.3%) of Hispanic households have children, a +17.3 point gap vs. Non-Hispanic households (33.0%). • For every segment (S, H, M, L), nearly half or more than half of Hispanic households have children A smaller percentage (33.0%) of Non-Hispanic households have children, dropping as low as 28.6% for the Light segment. Non-Hispanic Households Hispanic Households +17 pts. Higher +0.4 pt. vs. py -0.4 pt. vs. py Data Source: IRI Consumer NetworkTM 2017 vs. 2016 (All figures are rounded). See slide 21 for shopper segmentation methodology
Households with children also account for a greater share of purchases in Hispanic households vs. Non-Hispanic households Children Avocado Purchases - Households with Children Hispanic households with children make 47.9% of Hispanic avocado purchases, an +11.8 point gap vs. Non-Hispanic households (36.1%). • Across all segments (S, H, M, L), Hispanic households with children account for nearly half or more than half of avocado purchases. Non-Hispanic households with children account for 36.1% of total Non-Hispanic avocado purchases, falling to only 29.6% for the Light segment. Non-Hispanic Households Hispanic Households +12 pts. Higher +0.2 pt. vs. py -1.4 pts. vs. py Data Source: IRI Consumer NetworkTM 2017 vs. 2016 (All figures are rounded). See slide 21 for shopper segmentation methodology
Hispanic heads of household tend to be younger than Non-Hispanic heads of household HH Age Household Age 77.3% Total Hispanic vs. Non-Hispanic Households Segments 76.8% +0.3 pts vs. py 56.2% 62.0% -5.0 pts vs. py 77.3% of Hispanic household heads are under 55, a +21.1 point gap vs. Non-Hispanic household heads (56.2%). The largest age group for Hispanic households heads is 18-34 with a 30.7% share of Hispanic households, while the largest age group for Non-Hispanic households heads is 65+ (25.0% share). The proportion of younger household heads shows less variability among the Hispanic segments than among the Non-Hispanic segments (S, H, M, L) • For Non-Hispanic households, 62.0% of Super household heads are under 55, compared to 49.1% of Light household heads Data Source: IRI Consumer NetworkTM 2017 vs. 2016 (All figures are rounded). See slide 21 for shopper segmentation methodology
In Hispanic households, households under 55 account for a greater share of of avocado purchases than in Non-Hispanic households HH Age Avocado Purchases - Household Age 74.0% Total Hispanic vs. Non-Hispanic Households Segments 73.3% -1.9 pts vs. py 61.0% 62.4% -1.4 pts vs. py Hispanic households under 55 make 74% of Hispanic avocado purchases, a +13.0 point gap vs. Non-Hispanic households (61%) This gap for total Hispanic and Non-Hispanic households is driven by all household segments (S, H, M, L). Younger households heads play a larger role in Hispanic households for each segment. Data Source: IRI Consumer NetworkTM 2017 vs. 2016 (All figures are rounded). See slide 21 for shopper segmentation methodology * Age of the head of the household
Over half of Hispanic households reside in counties corresponding to the 25 largest U.S. cities* Counties Household Counties 55.5% Total Hispanic vs. Non-Hispanic Households Segments +0.8 pts vs. py 42.0% -3.7 pts vs. py 55.5% of Hispanic households reside in “A” counties, while 42.0% of Non-Hispanic households reside in “A” counties. More than half of Hispanic households in all segments except Medium reside in “A” counties. Across all segments, less than half of Non-Hispanic households reside in “A” counties, ranging from 45.6% for Super to 39.1% for Light. *”A” Counties. A List of the 25 largest U.S. cities available on slide 24 Data Source: IRI Consumer NetworkTM 2017 vs. 2016 (All figures are rounded). See slide 21 for shopper segmentation methodology
Hispanic households in “A” counties* account for the majority of total Hispanic avocado purchases Counties Avocado Purchases - Household Counties 60.9% Total Hispanic vs. Non-Hispanic Households Segments -0.5 pts vs. py 44.4% -2.4 pts vs. py The majority of Hispanic avocado purchases come from A counties (60.9%), and to a lesser degree, the majority of Non-Hispanic avocado purchase come from A counties (44.4%). More than 50% of Hispanic avocado purchases come from A counties for all segments except Medium. Conversely, across all segments, less than 50% of Non-Hispanic avocado purchases come from A counties. *”A” Counties = Corresponding counties in the 25 largest U.S. cities. A List of the 25 largest U.S. cities available on slide 24 Data Source: IRI Consumer NetworkTM 2017 vs. 2016 (All figures are rounded). See slide 21 for shopper segmentation methodology
The top two income groups make up the largest proportion of Hispanic and Non-Hispanic households HH Income Household Income 41.7% Total Hispanic vs. Non-Hispanic Households Segments 42.7% +0.8 pts vs. py 45.9% 54.5% -5.5 pts vs. py 41.7% of Hispanic households are in the higher income brackets ($70k+), a -4.2 point gap vs. Non-Hispanic households (45.9%). This gap is most prominent in the Super segment. 42.7% of Hispanic Super households are in the $70k+ income brackets, a -11.7 point gap vs. Non-Hispanic Super households (54.5%). Data Source: IRI Consumer NetworkTM 2017 vs. 2016 (All figures are rounded). See slide 21 for shopper segmentation methodology
The top two income groups also account for a larger share of Hispanic and Non-Hispanic avocado purchases HH Income Avocado Purchases - Household Income 40.2% Total Hispanic vs. Non-Hispanic Households Segments 39.7% +1.2 pts vs. py 52.6% 54.7% +1.4 pts vs. py The top two income groups ($70k+) make 40.2% of Hispanic household purchases, a -12.4 point gap vs. the top two income groups in Non-Hispanic households (52.6%). This gap is most prominent in the Super segment. The top two income groups make 39.7% of Hispanic Super household purchases, a -15.0 point gap vs. the top two income groups in Non-Hispanic Super households (54.7%) Data Source: IRI Consumer NetworkTM 2017 vs. 2016 (All figures are rounded). See slide 21 for shopper segmentation methodology
Methodology: Shopper Segmentation Shopper Segmentation by Purchase Level The shopper segmentation divides avocado purchasing households into four groups based on their annual avocado purchases levels*. The definitions for each of the four shopper segments are as follows: • Super, spend $25.36 or more annually on avocados ($69.60 on average) • Heavy, spend between $9.78 and $25.35 annually ($16.15 on average) • Medium, spend between $3.69 and $9.77 annually ($6.32 on average) • Light, spend $3.68 or less annually ($1.92 on average) Using the definitions above, this study identified the concentration of each of the four shopper segments in Hispanic (and Non-Hispanic households) and analyzed their demographics to uncover insights and growth opportunities for Hass avocados. Data Source: IRI Consumer NetworkTM 2017 (All figures are rounded) *Shopper segment purchase levels established by HAB’s Avocado Shopper Segmentation: Segment Dynamics by Region Study
Terms and Definitions • Hispanic and Non-Hispanic Household Groups • Hispanic Avocado Households – Households with Hispanic head of household • Non-Hispanic Avocado Households – Households with Non-Hispanic head of household • Shopper Segmentation: • By Purchase Level (Super, Heavy, Medium, Light) –See page 21 for methodology and definitions • Metrics: All figures in this report are rounded • Annual Spend per Avocado Household – Average annual spend on avocados per avocado buying household • Purchases – Throughout this report, “purchases” refers to dollar purchases. Volume/units/eaches are not available • Time Periods: • Current Year (CY) – 2017 Calendar year • Prior Year (PY) – 2016 Calendar year • Source Data: • IRI Consumer NetworkTM 2017 (Details on page 25)
Notes on Demographic Groups Each of the demographic categories presented in this report reflects standard sub-breaks available from the IRI National Consumer Panel (NCP) • Household Size • 1 • 2 • 3 • 4 • 5+ • Presence of Children in the Household • Households with children under 18 • Households with no children under 18 • Age of Head of Household • 18-34 • 35-44 • 45-54 • 55-64 • 65+ • Household Income • Under $20,000 • $20,000 - $24,999 • $25,000 - $34,999 • $35,000 - $44,999 • $45,000 - $49,999 • $50,000 - $59,999 • $60,000 - $69,999 • $70,000 - $99,999 • $100,000+ • Marital Status • Married • Single • Other (Divorced, Separated, Widowed) Continued on next slide…
Notes on Demographic Groups Counties • A: Counties in metropolitan areas of the 25 largest U.S. cities based on population* • B: Counties of over 150,000 population plus counties in metro areas over 150,000 • C: Counties of 40,000 to 150,000 population or in metro areas of over 40,000 • D: All remaining counties *25 Largest U.S. cities • New York, NY • Los Angeles, CA • Chicago, IL • Houston, TX • Philadelphia, PA • Phoenix, AZ • San Antonio, TX • San Diego, CA • Dallas, TX • San Jose, CA • Jacksonville, FL • Indianapolis, IN • San Francisco, CA • Austin, TX • Columbus, OH • Fort Worth, TX • Charlotte, NC • Detroit, MI • El Paso, TX • Memphis, TN • Baltimore, MD • Boston, MA • Seattle, WA • Washington, DC • Nashville-Davidson (metropolitan)
Data Source: IRI Consumer NetworkTM This report is based on household purchasing data from the IRI Consumer NetworkTM. IRI receives its household purchasing data from the National Consumer Panel (NCP), an operational joint venture by IRI and Nielsen. The NCP is a continuous household purchasing consumer panel that consists of a representative sample of U.S. households who electronically record all purchases. Households are recruited to the NCP and are incented to record all of their purchases, regardless of where purchased, using a handheld in-home scanning device. Household purchasing data complements retail sales data and provides a deeper understanding of category dynamics by focusing on shoppers and their purchase behaviors. In turn, understanding shopper purchase behaviors helps uncover opportunities for growth and aids in effective sales and marketing decisions. In-store purchases Electronically recorded at home
Thank you For additional retail information and insights please visit the Hass Avocado Board website at: hassavocadoboard.com