Download

1 / 11
110 likes | 112 Views
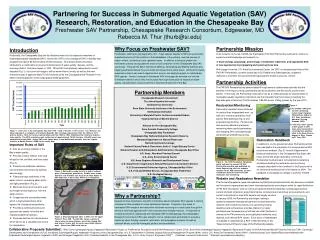
ORBIS, Brien Holden Vision Institute, and African Vision Research Institute collaborate to determine the relationship between poverty and visual impairment/blindness. Raw data from the War on Poverty Initiative is used to assess prevalence, correlation with poverty, and generate peer-reviewed articles. Literature review highlights the cycle of poverty and the need for strong eye health interventions to break it. Results show gender and employment status disparities in reported visual difficulty.

E N D
Introduction to the Consortium Members ORBIS is a non-profit organisation dedicated to saving sight worldwide – focussed on capacity building. Brien Holden Vision Institute is a non profit organisation dedicated to excellent and equitable vision care solutions for everyone, everywhere. The African Vision Research Institute (AVRI) is an African-based institute that links, institutions, organisations, academics and intellectuals in the pursuit of confronting the challenges of Africa’s eye health issues.
Background to the Project • Since 1994 the conditions of the poor in South Africa have progressively been improving. • 43% of the population is still trapped in poverty, with numerous barriers preventing them from accessing services • In July 2008 the South African Cabinet resolved that they would define a national poverty matrix, develop a database of households living in poverty, identify and implement specific interventions directed at these households, monitor progress in moving households out of poverty and co-ordinate and align poverty eradication programmes to maximise impact, avoid wastage and duplication. • The War on Poverty Initiative is one example of a programme designed enable households to access social security benefits as well as health care. • In July 2010 the three Consortium members met with War on Poverty Initiative and agreed to collaborate to determine the relationship between poverty and visual impairment/ blindness to support and enable service delivery mechanisms. • An agreement provided the Consortium with access to the raw data collected nationally across all the poorest areas.
Purpose of the Consortium • Raw data will be accessed from the Government’s WOP household surveys to: • Determine the prevalence of self-rated eye health needs amongst people in the most under-resourced settings. • Determine if visual impairment and blindness amongst the poorest people contributes to their poverty – through analysis of the correlation between selected categories such as disability, access to health care and blindness. • Generate and publish peer-reviewed articles on the profile of self-reported visually impaired and blind people who are poverty-stricken, as characterised by the National Development Agency (NDA).
Literature Review The literature shows that there is an association between Poverty and Eye Health Described in this figure The cycle of poverty starts and will not end unless strong eye health interventions and programmes are implemented Compiled into a REVIEW DOCUMENT Poverty & Eye Health • Enhance the discourse around poverty and eye health • Promote further research • Influence NGDOs to include more info & comments on Poverty and Eye Health in publications & documents • Aid Advocacy efforts with Governments and other civil society sectors • Promote a greater focus on the anti-poverty programmes by NGDOs
WOP Campaign Data Analysis: Results • Reported eye condition was considered as the dependent variable • All the other variables were taken as the dependent variables • Considering an additive relationship between the variables, the results show that at the 5% significant level: • that relationship, education, education needs, social needs, document needs, eating fruits, eating nuts, taking fats and oil and age and education interaction DO NOT EXPLAIN reported visual difficulty • that age, marital status, health needs, eating green vegetables, consuming dairy products, province, gender and spectacle use EXPLAIN VISUAL DIFFICULTY Prevalence Rates: The WOP campaign provided this investigation with a sample of 74 901 individuals from the 18 016 households. Reported Visual Difficulty by Gender: The prevalence was significantly higher in females, which was 12.7% (95% CI; 9.98%-15.41%) than in males which was. 9.5% (95% CI; 7.13%-11.87%).
WOP Campaign Data Analysis: Results Figure 1: Age comparisons: respondents with reported visual difficulty and those without The density f(x) distributions of reported visual difficulty were significantly higher for those 40 years old and above (K-S test, p=0.000) Figure 2: Reported visual difficulty by employment: including >15 years not in school A significant higher proportion of employed respondents (16.9% (95%CI16.17%-17.72%) reported to have visual difficulty and while 14.0% (95%CI 13.68%-14.37%) unemployed respondents reported to have visual difficulty.
WOP Campaign Data Analysis: Results Figure 3: Visual difficulty reported by employment status and expenditure • Percentages of reported visual difficulty are lower for non-working respondents when considering those that did not report visual difficulty in each expenditure category as shown in Figure 3. • When considering frequencies reported, visual difficulty is higher for non-working respondents compared to respondents who were working, which were 5 387 and 1 484 respectively. Figure 4: Reported visual difficulty by household size • The maximum number of occupants reported in a single household was 23. • Reported visual difficulty was highest for households with one occupant and was due to the high mean age in this category (47.17yeas± 18.93) compared to the other categories (26.6 years ± 20.7 years).
WOP Campaign Data Analysis: Results • Health and education needs were highest among respondents, followed by social and documentation needs. • 21.8% (3 384 out of 15 518) of the respondents with health needs reported to have visual difficulty compared to respondents with educational needs (5.8%). • Conclusion • Prevalence of self-reported visual impairment/ blindness was 11.2%. • Self-reported visual difficulty were higher in females, employed respondents. • Households with one occupants had higher mean age and showed higher prevalence of self-reported visual difficulty. • The findings of this study offers the opportunity to investigate the relationship between the subjective responses regarding visual impairment and the prevalence through a clinical evaluation and also further qualitative evaluations. Figure 5: Reported needs