Download
1 / 43
430 likes | 563 Views
Neonatal deaths in New Zealand. Dr David Knight Director of Neonatology Mater Mothers’ Hospital Brisbane Australia. Queensland Maternal and Perinatal Quality Council. Chequered history: 3 rd iteration Resurrected 3 years ago

E N D
Neonatal deaths in New Zealand Dr David Knight Director of Neonatology Mater Mothers’ Hospital Brisbane Australia
Queensland Maternal and Perinatal Quality Council • Chequered history: 3rd iteration • Resurrected 3 years ago • Produces report sent to Minister and Director General of Health • Sub-committees for Perinatal Mortality, Maternal Mortality, Congenital Anomalies and Indigenous Health • Data from QH Perinatal Data Collection • No separate perinatal mortality data source • No mandatory reporting of details of perinatal deaths
Perinatal and Maternal Mortality Review Committee • Set up by legislation • Mandatory reporting • Maternal deaths have to be reported to coroner • Almost all have autopsies • Setting up reviews of major maternal and neonatal morbidity
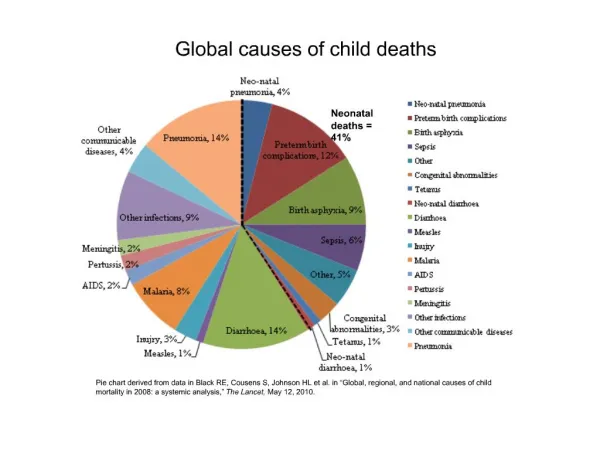
PN death classification 11 headings 66 sub-headings Headings Congenital anomaly Infection Hypertension Antepartum haemorrhage Maternal conditions Perinatal conditions Hypoxic Growth restriction Spontaneous preterm Unexplained No factors Neonatal death classification 7 headings 36 sub-headings Headings Congenital anomaly Extreme prematurity Cardiorespiratory Infection Neurological Gastrointestinal Other Why do babies die (PSANZ)?
PN Death classification Congenital anomaly 181 Spontaneous preterm 108 Unexplained 102 Antepartum haemorrhage 77 Perinatal conditions 75 Growth restriction 53 Maternal conditions 37 Hypertension 28 Hypoxic 28 Infection 24 No factors 7 Neonatal death classification Extreme prematurity 57 Congenital anomaly 43 Neurological 40 Infection 12 Cardiorespiratory 11 Other 11 Gastrointestinal 8 Why do babies die (PSANZ)?
Very preterm babies • PSANZ defines extreme prematurity as • Typically ≤24 weeks or ≤600g and either • Not resuscitated or • Unsuccessful resuscitation or • Unspecified or not known whether resuscitation attempted • Deaths in babies 24-27 weeks (other than “extreme prematurity”) classified as: • Cardiorespiratory • Infection • Neurological • Gastrointestinal • Other
Why do live-born babies die? • Congenital anomaly • Lethal/untreatable • Potentially survivable • Extreme preterm <24weeks • Few survivors • Very preterm 24-27 weeks • Potentially survivable • Preterm 28-36 weeks • Should survive • Term and post term • Should survive
Scottish Perinatal Mortality Report • Includes tables on “normally-formed birth weight and gestation specific mortality” • Separate for stillbirths and neonatal deaths • Tables are for singletons only
Why live-born do babies die?(numbers for 2007-9) • Congenital anomaly 124 25% • Lethal/untreatable • Potentially survivable • Extreme preterm ≤24weeks 155 30% • Few survivors • Very preterm 24-27 weeks 92 18% • Potentially survivable • Preterm 28-36 weeks 48 9% • Should survive • Term and post term 106 20% • Should survive
Very preterm 24-27 weeks(numbers for 2007-9) • Cardiorespiratory 22 24% • Extreme preterm 20 22% • Infection 18 20% • Neurological 17 18% • Other 8 9% • Gastrointestinal 7 8% • Total 92
Preterm 28-31 weeks(numbers for 2007-9) • Neurological 21 44% • Infection 13 27% • Other 7 15% • Cardiorespiratory 3 6% • Gastrointestinal 3 6% • Extreme preterm 1 2% • Total 48
Term and post-term neonatal deaths(numbers for 2007-9) • Neurological 64 60% • Other 27 25% • Infection 14 13% • Cardiorespiratory 1 1% • Total 106
Neonatal death rateNZ 2007-9excluding deaths from anomalies * Live-births less those with lethal anomalies
Perinatal death and multiple birth • Stillbirth rate 3 greater than that of singletons • Neonatal rate 7 greater • Perinatal rate 3.7 greater • One in 25 perinatal loss
Perinatal Mortality of singletons and multiples in Queensland1995-2007 Queensland Maternal and Perinatal Quality Council. 2010
Birth weight of singletons and multiples Pharoah POD, Clin Perinatol 2006;33:301– 313
Multiple pregnancy rate over time Black M, Bhattacharya S. Seminars in Fetal & Neonatal Medicine 2010;15:306-312
Multiple births and perinatal deaths • Strongly associated with fertility treatment • 7 of 70 perinatal deaths in multiples conceived with IVF, FSH or clomiphene Percentage of multiple births in pregnancies conceived with and without the use of fertility techniques Queensland 1995-2007
Multiple births by maternal age Black M, Bhattacharya S. Seminars in Fetal & Neonatal Medicine 2010;15:306-312
Outlook for multiple pregnancies • Stillbirth rate 3 greater than that of singletons • Neonatal death rate 7 greater • Perinatal death rate 3.7 greater • One in 25 perinatal loss • Five time rate of cerebral palsy • 1% cerebral palsy • Six point reduction in IQ NZ perinatal and maternal mortality report 2009 Pharoah POD, Clin Perinatol 2006;33:301– 313 Cooke RWI, Seminars in Fetal & Neonatal Medicine 2010;15:362-366
Socio-economic disadvantage Perinatal related death rates by deprivation quintile
<20 20-24 25-29 30-34 35-39 >40 18 16 14 12 10 Death rate (/1000) 8 6 4 2 0 TOP Stillbirth Neonatal death Total perinatal Perinatal death rate by maternal age
Perinatal death rate by maternal age • Mothers <20 years of age • Increased stillbirth, neonatal and perinatal deaths • Related to smoking (50%) and • SE deprivation (50% in highest quintile) • Ethnicity distribution similar to that of all perinatal deaths • Mothers >40 years of age • Increased TOP, stillbirths and perinatal deaths • Congenital anomalies 5/1000 vs. 3/1000 in younger women
“100 babies died needlessly – report” “The deaths of nearly 100 late term and newborn babies could have been prevented in 2009, new figures show.”
Contributory factors to perinatal deaths n = 169 • Organisational 34 • Health personnel 50 • Technology or equipment 6 • Environmental 12 • Access/engagement 111 • Acces • Cultural aspects • Social issues • Communication
Contributory factors to perinatal deaths • Organisational 34 • Health personnel 50 • Inadequate education and training 9 • Lack of policies or guidelines 10 • Failure to follow recommended best practice 24 • Knowledge/skill lacking 16
27 guidelines, succinct, 1-2 pages 65+ guidelines 254 neonatal guidelines, short practical guides Clinical Guidelines • NZ Guidelines Group: • 1 perinatal guideline, 2004, 106 pages • Professional groups • Individual hospitals
Formed in 2009 • Evidence informed consensus guidelines • Produce guidelines • Clinical lead • Volunteer members from interested lay and health groups • Published on the web • Education and audit project • Financial reward to institutions for implementing guidelines
18 published guidelines • 9 Maternity • 9 Neonatal • 13 to 31 pages long • All have a flow sheet designed for display in clinical units
Maternity guidelines • Published • Stillbirth care • Early onset Group B streptococcal disease • Intrapartum fetal surveillance • Hypertensive disorders • Obesity • Vaginal birth after caesarean section • Primary post partum haemorrhage • Venous thromboembolism prophylaxis • Preterm labour • In preparation • Non-urgent referral for antenatal care Consultation • Maternity shared care • Early pregnancy loss • Normal birth • Perineal care • Review: Postpartum haemorrhage
Neonatal Guidelines • Published • Breastfeeding initiation • Examination of the newborn • Neonatal hypoglycaemia • Hypoxic ischaemic encephalopathy • Neonatal jaundice • Neonatal abstinence syndrome • Respiratory distress and CPAP • Neonatal resuscitation • Term small for gestational age baby • In preparation • Neonatal stabilisation for retrieval • Neonatal pain • Neonatal seizures • Review – neonatal resuscitation
Controlled trials: is this the first?Holy Roman Emperor Frederick II 1194-1250 • Aim: • Does exercise influence digestion? • Designed a controlled clinical trial • 2 Knights ate a meal • 1 exercised • 1 slept • Killed both Knights and looked at stomach contents • Conclusion: • Exercise inhibits gastric emptying
Controlled trials • Bill Silverman and retinopathy of prematurity • Mont Liggins, Ross Howie and antenatal steroids • Brian Darlow and the Boost II studies • Oxygen saturation targeting in preterm infants
Epidemiology:Florence Nightingale • Educated woman • Latin, Greek, History, Mathematics • Used statistics to prove her hypotheses • 1st female member of Royal Statistical Society in 1858 • Honorary member of American Statistical Society
Epidemiology • Richard Doll, Austin Bradford and smoking • NZ Perinatal and Maternal Mortality Review Committee
Conclusions • NZ has an impressive setup for gathering data • The report in comprehensive and timely • The report contains detailed analysis of deaths, not just raw data • Needs more data on all births so that denominator known in subgroups
Suggestion • Separate reporting of congenital anomalies • Data on gestational age and birth weight specific mortality in babies without anomalies
Conclusion • NZ outcomes compare well with UK and Australia • Outcomes for multiple pregnancies significantly worse than for singletons • Worse outcome for youngest and oldest mothers • Noteworthy that there is an uneven risk related to ethnicity, deprivation decile and DHB of birth • DHB outcomes likely to related to the other two factors • This is seen in all countries
Thank you for the invitation to comment on this impressive report and these excellent results