Download
1 / 52
520 likes | 770 Views
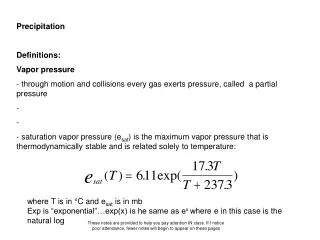
Vapor Pressure and Changes of State. Heat of vaporization. Enthalpy of vaporization energy required to vaporize 1 mole of a liquid at a pressure of 1 atm H vap. Vapor pressure -in closed container. Vapor molecules reform to a liquid condensation

E N D
Heat of vaporization • Enthalpy of vaporization • energy required to vaporize 1 mole of a liquid at a pressure of 1 atm Hvap
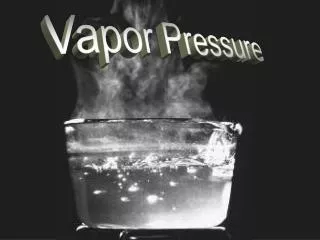
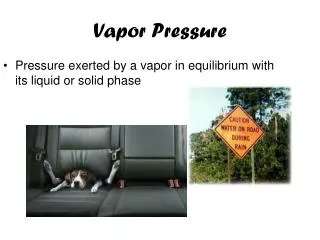
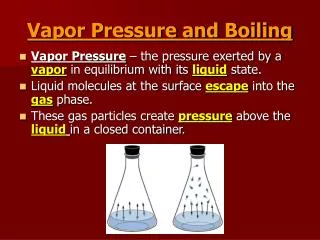
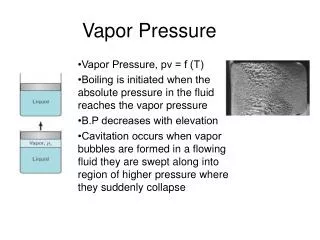
Vapor pressure-in closed container • Vapor molecules reform to a liquid • condensation • eventually rate of condensation = rate of evaporation
equilibrium • When no further net change occurs in the amt of liquid or vapor b/c the two opposite processes exactly balance each other
No net change? • System is highly dynamic on the molecular level! • Means molecules are constantly escaping and entering the liquid
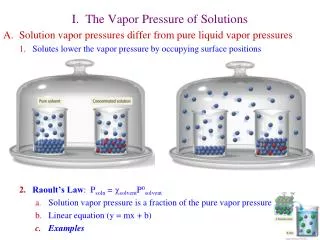
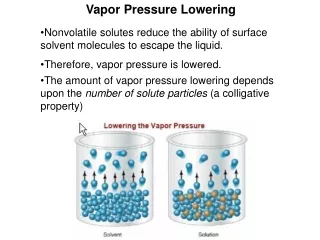
Vapor pressure • Determined by intermolecular forces • large IM forces = low vp • the molecules need a lot of energy to escape
High vapor pressure • Evaporate readily from an open dish • volitile
Temperature? • Vapor pressure for a given liquid increases significantly with temperature • why?
graphs • vp verses temperature • nonlinear increase • straight line by plotting ln(Pvap) versus 1/T (in K)
Straight line • ln(Pvap) = -Hvap/R (1/T) + C • Hvap = enthalpy of vap • R = universal gas const • C = const for each liquid
Impt relationship • Can find Hvap by measuring Pvap at several temps and evaluating slope
Two temps • Can combine the eqn b/c C does not dept on temp in order to solve for Pvap at another temp
Equation • Ln(PvapT1) - ln(PvapT2) = Hvap/R (1/T2 - 1/T1) • OR • Ln(PT1/PT2) = Hvap/R (1/T2 - 1/T1)
Solve • The vp of water at 25oC is 23.8 torr and the Hvap at 25oC is 43.9 kJ/mol. What is the vp at 50. oC?
Changes of state • What happens when a solid is heated? • Heat solid --> melt to liquid --> liquid will boil to gas state
Heating curve • Plot of time vs temp for a process where energy is added at a constant rate
Energy into ice • Random vibrations of water molecules increase • break from lattice and change to liquid
Enthalpy of fusion • energy added to break (or disrupt) the ice structure by breaking H-bonds • enthalpy change that occurs to melt a solid at the melting point (kJ/mol)
0oC • Temp is constant until all solid changes to liquid • then temp will increase again
100oC • Temp is constant until all the liquid changes to a gas • physical changes
Melting point • As the temp of the solid is increased, a point is eventually reached where the liquid and solid have identical vapor pressures
Normal melting pt • The temp at which the solid and liquid states have the same vp under the conditions where the total pressure is 1 atm
Normal boiling pt • Temperature at which the vp of the liquid is exactly 1 atm • boiling occurs when the vp of the liq is equal to the pressure of its environment
Phase Diagrams • Represent the phases of a substance as a function of temperature and pressure
Phase Diagrams • Shows which state can exist as given temp and pressure • conditions of CLOSED system
Experiment 1 • Pressure is 1 atm • initial- temp -20oC • no vapor in cylinder (b/c at 0oC the vp is less than 1atm)
Ice melts to liquid (still no vapor) • at 100oC, vp is 1 atm and water boils • changes until all steam
Experiment 2 • Pressure is 2.0 torr • ice is only component (-20oC, 2 torr) • at -10oC, ice --> vapor • sublimation (vp of ice = external pressure)
Experiment 3 • Pressure is 4.588 torr • -20oC (ice only component) • cylinder heated- no new phase until .0098oC
TRIPLE point- solid and liquid have identical vp at 4.588 torr • only at these conditions (.01oC) can all three states of water coexist
Experiment 4 • Pressure is 225 atm • start with liquid water (300oC, 225 atm) b/c of high pressure
Liquid changes to vapor as temp increases, but goes through intermediate “fluid” region which is neither true vapor or liquid
Critical temp • temp above which vapor cannot be liquified no matter what pressure is applied
Critical Pressure • Pressure required to produce liquification at the critical temp
Critical point • Defined by critical pressure and temp (374oC, 218 atm) • beyond this point is intermediate “fluid” region
Phase diagram for water • Solid/liquid line has negative slope • mp of water decreases as external pressure increases
Phase diagram for water • Opposite of most substance b/c density of ice less than water at mp
Phase diagram for CO2 • Solid/liquid line has positive slope • solid CO2 is more dense than liquid CO2