Download

1 / 68
680 likes | 803 Views
Partnership for Environmental Research and Community Health (PERCH). Spatial associations between health outcomes and air emission sites in NW FL. Johan Liebens Zhiyong Hu Department of Environmental Studies University of West Florida K. Ranga Rao

E N D
Partnership for Environmental Research and Community Health (PERCH) Spatial associations between health outcomes and air emission sites in NW FL Johan Liebens Zhiyong Hu Department of Environmental Studies University of West Florida K. Ranga Rao Center for Environmental Diagnostics and Bioremediation University of West Florida
Background: Health outcome study • Studnicki, J. et al., 2004 (PERCH). • Health outcomes responsive to air pollution. • Mortality and morbidity, by age and race. • Standardized mortality and morbidity ratios (SMRs) • State average = 1 • ZIP code as spatial unit. • Comparison with "peer" ZIP codes.
Peer ZIP codes After Studnicki, J. et al. (2004)
Main Objective • Evaluate if spatial and statistical relationships exist between health outcome SMRs and proximity to air emission sites.
Data • Spatially referenced air emission data from: • Toxic Release Inventory - TRI (EPA website). • Major industrial emitters. • 16 TRI sites in NW Florida, 107 in peer ZIP codes. • FL DEP (Florida Department of Environmental Protection) headquarters. • Major and minor emitters statewide. • 34 sites in NW Florida, 1111 in peer ZIP codes.
Methods • Calculate proximity indexes for ZIP codes: • Determine indexes for average distance from census block centroid to air emission sites within 10 km. • Weight proximity indexes for block centroids with emissions: • Benzene-equivalent pounds for TRI sites. • Standardizes emissions based on carcinogenicity. • Total emissions for FL DEP database. • Calculate average weighted proximity indexes for each ZIP code.
Methods (continued) • Statistically compare weighted proximity indexes: • For ZIP codes with contrasting SMRs within NW Florida. • For NW Florida ZIP codes and their respective peer ZIP codes. • Make comparison for: • Cumulative health outcomes. • Specific health outcomes.
Results Cumulative health outcomes: • No statistically significant difference between weighted proximity indexes. • For ZIP codes with contrasting SMRs within NW Florida. • For NW Florida ZIP codes with high/low SMR and peer ZIP codes.
Benzene-equivalent weighted proximity index (TRI sites) Comparison within NW Florida worse health outcomes better health outcomes
ResultsSpecific health outcomes: • Qualitative differences in weighted proximity indexesfor 3 (4?) causes of mortality and 3 causes of morbidity. • Mortality: white, >65, cardiac black, >65, lung cancer, (all cancers ?) black, birth defects • Morbidity: black, all ages, asthma black, >65, cardiac white, >65, pneumonia • NW FL ZIPs with a high SMR for these health outcomes are: • closer to emission sites than NW FL ZIPs with a low SMR. • closer to emission sites than their peer ZIP codes.
blacks, >65 all cancers blacks, > 65 lung cancer whites, > 65 cardiac Blacks, birth defects high low SMR high low SMR high low SMR high low SMR FL DEP database, emission weighted proximity index
Conclusions • No statistical difference between weighted proximity indexes when ZIP codes are classified based on cumulative health outcomes. • Qualitative differences in weighted proximity indexes when ZIP codes are classified using specific health outcomes.
Conclusions (continued) • Issues: • ZIP code as geographic unit of analysis in original health study. • Spatial quality of databases. • Aggregating emission data from various sources. • Mobility, lifestyle. • Solution: • Raster-based spatial statistical modeling. • Remote sensing-based exposure assessment.
Thank You • Student assistants: Johanna Jenkins, Angela Worley, Kristal Walsh. • EPA cooperative agreement X-97455002. • Original health outcome study: Studnicki, J. et al. (2004).
PERCH Symposium Zhiyong Hu, Johan Liebens, K. Ranga Rao Relationship between Air Pollution and Health Outcomes
Content • Stroke mortality and air pollution. • Chronic heart disease and PM2.5. • Chronic heart disease and aerosol particulate pollution as indicated by satellite derived aerosol optical depth (AOD) data.
Background • Stroke: A type of cardiovascular disease that affects the arteries leading to and within the brain. It occurs when a blood vessel that carries oxygen and nutrients to the brain is either blocked by a clot (ischemic) or bursts (hemorrhagic). • Air pollution is known to be associated with cardiovascular disease, but relatively few studies have examined the association between air pollution and stroke mortality. • Results from existing studies on air pollution and stroke are inconsistent and inclusive. • Studies have documented positive effects of green areas on human health. No studies have been done to investigate the association between stroke and greenness. • Considerable evidence of income inequality affecting health. Does income affect stroke mortality?
Objective and Methods • Objective Investigate if there are associations between stroke and air pollution, income and greenness in northwest Florida. • Methodology: - Ecological geographical approach: disease & income data based on 77 census tracts, spatial support for environmental variables transformed to match census units. - GIS analysis, satellite remote sensing, and dasymetric mapping. - Bayesian hierarchical modelling
Study Area • Escambia and Santa Rosa counties in northwest Florida. • Fact: In 2003, stroke age-adjusted death rate (per 100,000) is: 53.5 U.S. 42.4 Florida 74.1 Escambia County 50.0 Santa Rosa County.
Stroke mortality rate standardization • Stroke death count data at the census tract level compiled from Florida Vital Statistics in a 5-year (1998-1992) aggregate. • To adjust for age effect, expected number of stroke deaths for each census tract was calculated using indirect standardization. • Use the US South population as standard population. • Standardized mortality rates (SMRs) were calculated by dividing the observed count by the expected value.
Air Pollution Data Point Source
Air Pollution Density We used polluter density surfaces to derive surrogate variables representing air pollution. Point source - Based on emission amount - Based on abundance of points Traffic data - Based on kernel surface The density surfaces were further used to calculate aggregate zonal statistics (average density) based on dasymetric mapping.
Greenness extracted from Landsat ETM+ imagery using tasseled cap transformation
Average air pollution density for each tract was calculated using grid cells within human activity area only
Bayesian hierarchical modelling of relationship between stroke and income and environment exposure
Model Fitting • Markov chain Monte Carlo (MCMC) simulation and Gibbs sampling algorithm. • WinBUGS software - an interactive Windows version of the BUGS(Bayesian inference Using Gibbs Sampling). • Spatial weights as input to CAR generated using GIS. • A total of 10,000 iterations with 5,000 burn-in was run. Inference was based on iterations 5,001 to 10,000.
Trace plots of the 10,000 Markov Chain Monte Carlo (MCMC) updates. Simulation trace plots for the intercept, income effect, traffic air pollution effect, effect of EPA and Florida DEP monitored point source air emission, effect of non-monitored point source air pollution, and greenness effect for the Bayesian hierarchical model with a convolution prior.
Kernel estimates of the posterior densities of the fixed effects
Findings and Conclusions • An excess risk of stroke mortality in areas with high air pollution levels. • Higher risk of stroke mortality occurs in areas with lower income. • Exposure to more green space could reduce the risk of stroke mortality. • The findings point to the issues of environmental injustice, socioeconomic injustice and health inequality.
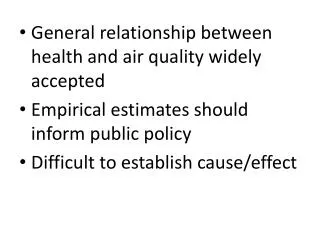
Background • Numerous studies have found adverse health effects of acute and chronic exposure to fine particulate matter (particles smaller than 2.5 micrometers, PM2.5). • Air pollution epidemiological studies relying on ground measurements provided by monitoring networks are often limited by sparse and unbalanced spatial distribution of the monitors. • The repetitive and broad-area coverage of satellites may allow atmospheric remote sensing to offer a unique opportunity to monitor air quality at continental, national and regional scales. • Studies have found correlations between satellite aerosol optical depth (AOD, which describes the mass of aerosols in an atmospheric column) and PM2.5 in some land regions. Satellite aerosol data may be used to extend the spatial coverage of PM2.5 exposure assessment.
Objectives • Investigate correlation between PM2.5 and AOD in the conterminous USA. • Derive a spatially complete PM2.5 surface by merging satellite AOD data and ground measurements based on the potential correlation. • Examine if there is an association of chronic coronary heart disease (CCHD) with PM2.5.
Methods • Years 2003 and 2004 daily MODIS (Moderate Resolution Imaging Spectrometer) Level 2 AOD images were collated with US EPA PM2.5 data covering the conterminous USA. • Pearson’s correlation and geographically weighted regression (GWR) analyses of the relationship between PM2.5 and AOD. • The GWR model was used to derive a PM2.5 grid surface using the mean AOD raster. • Fitting of a Bayesian hierarchical model linking PM2.5 with age-race standardized mortality rates (SMRs) of chronic coronary heart disease.
MODerate-resolution Imaging Spectroradiometer (MODIS) • Onboard NASA Satellites Terra & Aqua • Launched 1999, 2002 • 705 km polar orbits, descending (10:30 a.m.) & ascending (1:30 p.m.) • Sensor Characteristics • 36 spectral bands ranging from 0.41 to 14.385 µm • Cross-track scan mirror with 2330 km swath width • Spatial resolutions: • 250 m (bands 1 - 2) • 500 m (bands 3 - 7) • 1000 m (bands 8 - 36) • 2% reflectance calibration accuracy
MONITORING AND FORECASTING OF AIR QUALITY: AEROSOLS Annual mean PM2.5 concentrations (2002)derived from MODIS AODs van Donkelaar et al. [JGR 2007]
MODIS Data • Daily level 2 MODIS data (2003-2004) were obtained from the NASA Level 1 and Atmosphere Archive and Distribution System (LAADS Web) [35]. • A two-year average AOD raster data layer (10 km by 10 km grid) was calculated. • Data from both Terra and Aqua satellites were used. • MODIS AOD data are not available every day due to cloud cover. Data for cold seasons (October to March) were not used in the two-year average calculation and correlation analysis. Cloud cover, snow reflectivity, and diminished vertical mixing all reduce the accuracy of ground-level pollutant levels measured in winter. During warm seasons, vertical columns in the atmosphere are more integrated. AOD measures correlate best with ground-based monitoring in warm months, likely because of stronger boundary layer mixing during the warmer months.