Download
1 / 4

E N D
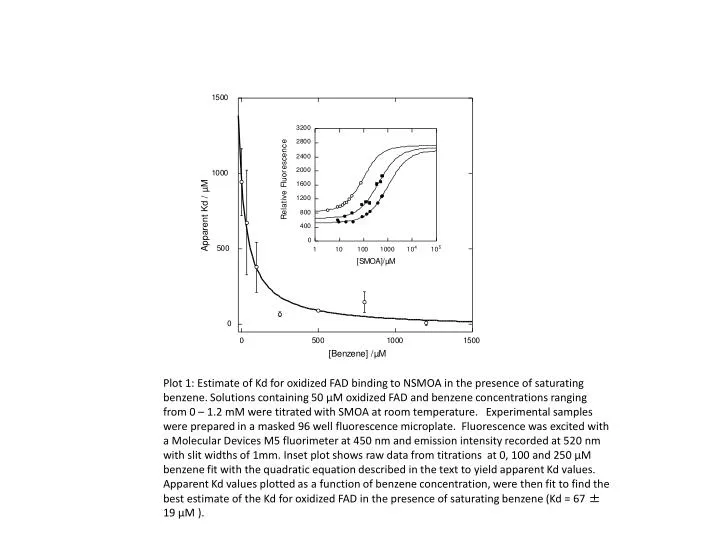
Plot 1: Estimate of Kd for oxidized FAD binding to NSMOA in the presence of saturating benzene. Solutions containing 50 µM oxidized FAD and benzene concentrations ranging from 0 – 1.2 mM were titrated with SMOA at room temperature. Experimental samples were prepared in a masked 96 well fluorescence microplate. Fluorescence was excited with a Molecular Devices M5 fluorimeter at 450 nm and emission intensity recorded at 520 nm with slit widths of 1mm. Inset plot shows raw data from titrations at 0, 100 and 250 µM benzene fit with the quadratic equation described in the text to yield apparent Kd values. Apparent Kd values plotted as a function of benzene concentration, were then fit to find the best estimate of the Kd for oxidized FAD in the presence of saturating benzene (Kd = 67 ± 19 µM ).
Plot 2: Estimates of NSMOA-Bound FAD Equilibrium Redox Potential in the presence and absence of 1.2 mM benzene. Apparent FAD midpoint potentials in the presence(solid circle) and absence(open circles) plotted as a function of the SMOA concentration at which they were determined. Limiting values of the bound flavin potential were calculated to be -114 ± 31 mV in the presence and -126 ± 7 mV in the absence of benzene. Inset plot shows an example of the solution-potential data used to compute the apparent midpoint potential at 80 µM NSMOA.
Plot 3: Kinetics of Oxidized FAD Binding to NSMOA: The reaction of NSMOA oxidized FAD was studied by stopped-flow fluorescence spectroscopy. A solution of 280 µM NSMOA was rapidly mixed with 50 µM FAD in the stopped-flow cell. The sample was exited 450nm light from a Xenon arc lamp projected through an excitiation monochromater with 5 nm spectral resolution. Fluorescence emission was monitored at 520 nm using a VG-6 band-pass filter. A four-exponential fit through the data returned estimated rate constants of k1= 265 s-1, k2 = 120 s-1, k3 = 21 s-1, and k4 = 0.34s-1.
Scheme X: Linkage of Ligand Binding and Redox Equilibria of SMOA