Download
1 / 1
10 likes | 159 Views
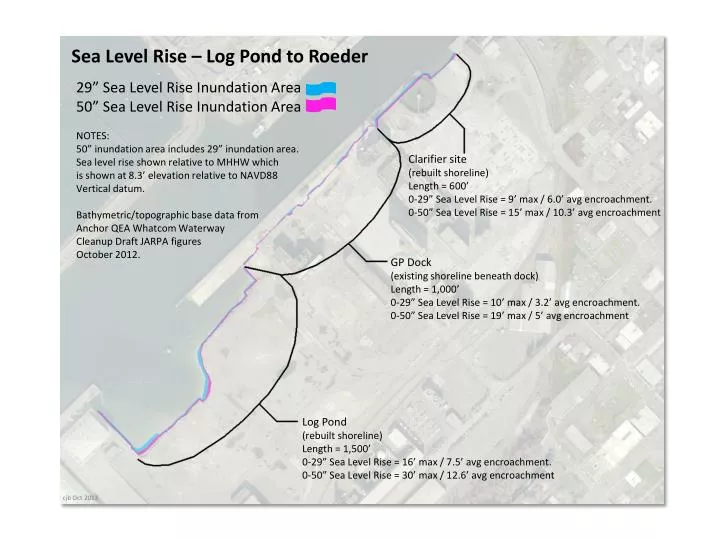
Sea Level Rise – Log Pond to Roeder. 29” Sea Level Rise Inundation Area 50” Sea Level Rise Inundation Area NOTES: 50 ” inundation area includes 29” inundation area. Sea level rise shown relative to MHHW which i s shown at 8.3’ elevation relative to NAVD88 Vertical datum.

E N D
Sea Level Rise – Log Pond to Roeder 29” Sea Level Rise Inundation Area 50” Sea Level Rise Inundation Area NOTES: 50” inundation area includes 29” inundation area. Sea level rise shown relative to MHHW which is shown at 8.3’ elevation relative to NAVD88 Vertical datum. Bathymetric/topographic base data from Anchor QEA Whatcom Waterway Cleanup Draft JARPA figures October 2012. Clarifier site (rebuilt shoreline) Length = 600’ 0-29” Sea Level Rise = 9’ max / 6.0’ avg encroachment. 0-50” Sea Level Rise = 15’ max / 10.3’ avg encroachment GP Dock (existing shoreline beneath dock) Length = 1,000’ 0-29” Sea Level Rise = 10’ max / 3.2’ avg encroachment. 0-50” Sea Level Rise = 19’ max / 5’ avg encroachment Log Pond (rebuilt shoreline) Length = 1,500’ 0-29” Sea Level Rise = 16’ max / 7.5’ avg encroachment. 0-50” Sea Level Rise = 30’ max / 12.6’ avg encroachment cjb Oct 2013