Download
1 / 21
220 likes | 512 Views
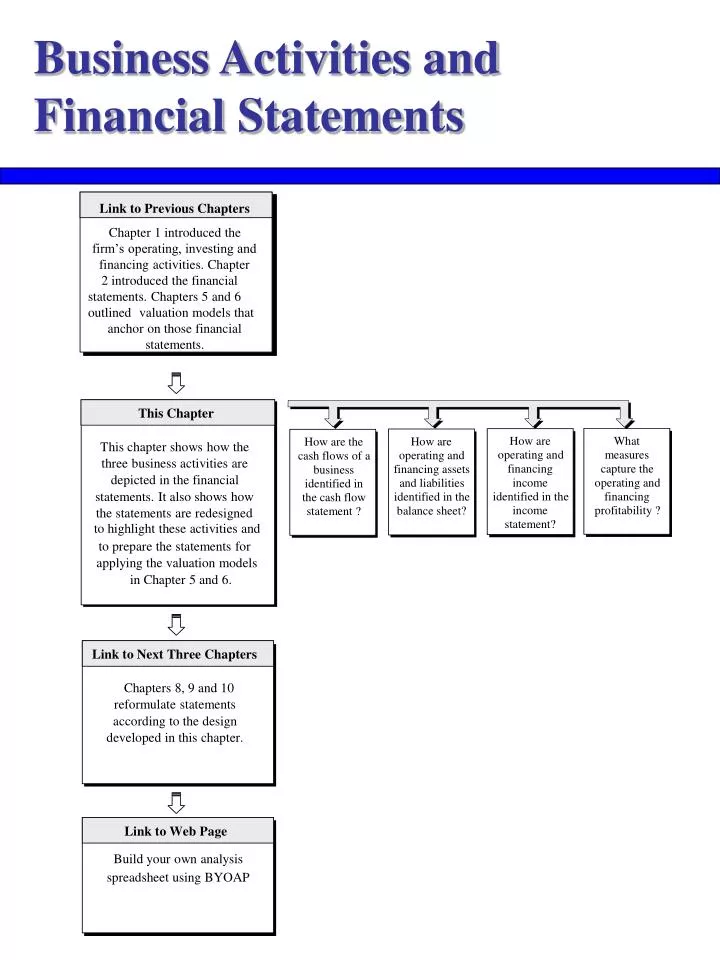
Business Activities and Financial Statements. Link to Previous Chapters. Chapter 1 introduced the. firm’s operating, investing and. financing activities. Chapter. 2 introduced the financial. statements. Chapters 5 and 6 outlined. valuation models that. anchor on those financial

E N D
Business Activities and Financial Statements Link to Previous Chapters Chapter 1 introduced the firm’s operating, investing and financing activities. Chapter 2 introduced the financial statements. Chapters 5 and 6 outlined valuation models that anchor on those financial statements. This Chapter How are What How are How are the This chapter shows how the operating and measures operating and cash flows of a three business activities are financing capture the financing assets business depicted in the financial income operating and and liabilities identified in statements. It also shows how identified in the financing identified in the the cash flow income profitability ? balance sheet? statement ? the statements are redesigned statement? to highlight these activities and to prepare the statements for applying the valuation models in Chapter 5 and 6. Link to Next Three Chapters Chapters 8, 9 and 10 reformulate statements according to the design developed in this chapter. Link to Web Page Build your own analysis spreadsheet using BYOAP
Cash Flows Between the Firm and Claimants in the Capital Market Cash received from debtholders and shareholders is (temporarily) invested in financial assets. Cash payments to debtholders and shareholders are made by liquidating financial assets (that is, selling debt). Net financing assets are debt purchased from issuers, net of debt issued to debtholders. Net financing assets can be negative (that is, debt sold to debtholders is greater than debt purchased). Key: F = net cash flow to debtholders and issuers d = net cash flow to shareholders NFA = net financial assets = financial assets – financial liabilities
Business Activities: All Cash Flows Cash generated from operations is invested in net financial assets (that is, it is used to buy financial assets or to reduce financial liabilities). Cash investment in operations is made by reducing net financial assets (that is, by liquidating financial assets or issuing financial obligations). Cash from operations and cash investment may be negative (such that, for example, cash can be generated by liquidating an operating asset and investing the proceeds in a financial asset). Key: F = net cash flow to debtholders and issuers d = net cash flow to shareholders C = cash flow from operations I = cash investment NFA = net financial assets NOA = net operating assets = operating assets – operating liabilities
The Cash Conservation Equation A fundamental accounting identity: C = Net cash from operations I = Net cash outflow for investing C - I = Free cash flow d = Net dividends (common dividends + share repurchases, less share issues) F = Net cash outflow to debtholders and debt issuers = Net principal payments for borrowing + net interest payments The treasurer’s rule: If : lend or buy down own debt If : borrow or reduce lending
Applying the Treasurer’s Rule: Microsoft In millions 2nd Quarter, 2004 2nd Quarter, 2005 Cash flow from operations $4,236 $3,377 Cash investment in operations 172 177 Free cash flow 4,064 3,200 Cash interest received (after tax) 338 242 Cash available for shareholders 4,402 3,442 Net dividend: Cash dividend $1,729 $33,498 Share repurchases 730 969 Share issues (189) 2,270(795) 33,672 Purchase (sale) of financial assets $2,132 $(30,230)
Applying the Treasurer’s Rule: General Electric In millions 2002 Cash flow from operations $34,848 Cash investment in operations 61,227 Free cash flow (26,379) Interest paid (after tax) 6,082 Cash available to shareholders (32,461) Net dividend: Cash dividend $7,157 Share repurchases 985 8,142 Net issue of debt $40,603 As the treasurer had $57.8 billion of debt to repay, he issued $97.9billion of new debt, for a net debt issue of $40.1 billion.
Reformulated Cash Flow Statements: Microsoft In millions 1Q, 2004 1Q, 2005 Cash flow from operations (C) $4,236 $3,377 Cash investment (I) (172) (177) Free cash flow (C – I) 4,064 3,200 Equity financing flows (d): Dividends and share repurchases $2,459 $34,467 Share issues (189) 2,270 (795) 33,672 Debt financing flows (F): Net purchase of financial assets 2,132 (30,230) Interest on financial assets (after tax) (338) (242) Net issue of debt - - Interest paid on debt (after tax) _____ _____ Total financing flows (d + F) $4,064 $3,200 C – I = d + F
Reformulated Cash Flow Statement: General Electric In millions 2002 Cash flow from operations (C) $34,848 Cash investment (I) (61,227) Free cash flow (C – I) (26,379) Equity financing flows (d): Dividends and share repurchases $8,142 Share issues - 8,142 Debt financing flows (F): Net purchase of financial assets - Interest on financial assets (after tax) - Net issue of debt (40,603) Interest paid on debt (after tax) 6,082 Total financing flows (d + F) $(26,379)
Reformulated Balance Sheet: Nike Inc. (in millions of dollars) 2004 2003 2004 2003 Operating assets (OA) 6,728 6,241 Financial obligations (FO) 879 883 Operating liabilities (OL) 2,1771,911 Financial assets (FA) (1,168) (581) Net financial obligations (NFO) (289) 302 Common equity (CSE) 4,8404,028 Net operating assets 4,5514,330 Total NFO + CSE 4,551 4,330 Balance sheet relations: NOA = OA – OL = 6,728 – 2,177 = 4,551 NFO = FO – FA = 879 – 1,168 = (289) (a net financial asset position) CSE = NOA – NFO = 4,551 + 289 = 4,840
Business Activities:All the Stocks & Flows Net operating assets are employed in operations to generate operating revenue (by selling goods and services to customers) and incur operating expenses (by buying inputs from suppliers). ∆ indicates changes. Key: F = net cash flow to debtholders and issuers d = net cash flow to shareholders C = cash flow from operations I = cash investment NFA = net financial assets NOA = net operating assets OR = operating revenue OE = operating expense OI = operating income NFI = net financial income
Reformulated Income Statement • The difference between operating revenue and operating expense is called operating income: Net financial expense can be negative (net financial income)
Reformulated Income Statement: Nike Inc. In millions 2004 Operating income (OI) 1,035 Net financial expense (NFE) 16 Comprehensive income (CI) 1,019
Business Activities and the Financial Statements This figure shows how reformulated income statements, balance sheets, and the cash flow statements report the operating and financing activities of a business, and how the stocks and flows are uncovered in the financial statements. Operating income increases net operating assets and net financial expense increases net financial obligations. Free cash flow is a “dividend” from the operating activities to the financial activities: free cash flow reduces net operating assets and also reduces net financial obligations. Net dividends to shareholders are paid out of net financial obligations.
Stocks & Flows:Operating and Financing Activities • The change in NFO is given by • The change in NOA is given by • Operating income in the income statement flows to net operating assets in the balance sheet. • Free cash flow reduces NOA and reduces NFO (increases NFA). If the firm has net financial assets rather than NFO, NFAt = NFAt-1 + (Ct – It) + NFIt – dt
The Reformulated Statements: Nike Inc., 2004 Reformulated Balance Sheets 2004 2003 2004 2003 Operating assets (OA) 6,728 6,241 Financial obligations (FO) 879 883 Operating liabilities (OL) 2,1771,911 Financial assets (FA) (1,168) (581) Net financial obligations (NFO) (289) 302 Common equity (CSE) 4,8404,028 Net operating assets 4,5514,330 Total NFO + CSE 4,5514,330 Reformulated Income Statement, 2004 Operating income (OI) 1,035 Net financial expense (NFE) 16 Comprehensive income (CI) 1,019 Reformulated Cash Flow Statement, 2004 Free cash flow 814 Equity financing flows: Net dividend to shareholders (d) 207 Debt Financing flows: Net cash to debtholders/issuers (F) 607 814
Accounting Relations: Nike Inc., 2004 Balance sheet relations: NOA = OA – OL = 6,728 – 2,177 = 4,551 NFO = FO – FA = 879 – 1,168 = (289) (a net financial asset position) CSE = NOA – NFO = 4,551 + 289 = 4,840 Income statement relations: CI = OI – NFE = 1,035 – 16 = 1,019 Articulating relationsbetween statements: The stocks and flows equation for equity: CSE2004 = CSE2003 + CI2004 – d2004 = 4,028 +1,019 – 207 = 4,840 The free cash flow generation and disposition equations: C – I = OI – ΔNOA = 1,035 – 221 = 814 C – I = NFE – ΔNFO + d = 16 – (-591) + 207 = 814 The stocks and flows equation for operating activities: NOA2004 = NOA2003 + OI2004 – (C – I)2004 = 4,330 + 1,035 - 814 = 4,551 The stocks and flows equation for financing activities: NFO2004 = NFO2003 + NFE2004 – (C – I)2004 + d2004 = 302 + 16 - 814 + 207 = -289
Tying it Together:What Generates Value? • From the balance sheet equation Given the way that NOA and NFO are calculated, which is the stocks and flows equation. • For this to be true, however, accounting must be Clean Surplus. • Free cash flow drops out in this calculation: Free cash flow (C - I) does not add value to shareholders. Free cash flow is a dividend from the operating activities to the financing activities • What generates value is the profit from operating and financing activities.
Stocks & Flows Ratios:Business Profitability • Separating operating and financing activities in the income statement identifies profit flows • Comparison of these flows with their balance sheet base yields the corresponding rates of return: Return on Net Operating Assets Return on Net Financial Assets If there are NFO rather than NFA, net borrowing cost is given by • Forecasting ROCE involves both the forecast of RNOA and RNFA (or NBC)