Download
1 / 30
300 likes | 617 Views
Quality of life Assessment introduction. Jan J. v. Busschbach, Ph.D. www.xs4all.nl/~jannetvb/busschbach Department of Medical Psychology and Psychotherapy, Erasmus MC j.vanbusschbach@erasmusmc.nl +31 10 4087807 Psychotherapeutic Centrum ‘De Viersprong’, Halsteren

E N D
Quality of life Assessmentintroduction • Jan J. v. Busschbach, Ph.D. • www.xs4all.nl/~jannetvb/busschbach • Department of Medical Psychology and Psychotherapy, Erasmus MC • j.vanbusschbach@erasmusmc.nl • +31 10 4087807 • Psychotherapeutic Centrum ‘De Viersprong’, Halsteren • Jan.Busschbach@deviersprong.nl • +31 164 632200
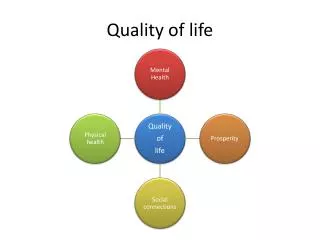
Quality of life • “…. Health is physical, mental and social well-being and not merely the absence of disease or infirmity...” • World Health Organization, 1947 • Extending health to well-being: Quality of life • What is the definition of quality of life?
Definitions of Quality of Life • Quality of life is the degree of need and satisfaction within the physical, psychological, social, activity, material and structural area (Hörnquist, 1982). • Quality of life is the subjective evaluation of good and satisfactory character of life as a whole (De Haes, 1988). • Health related quality of life is the subjective experiences or preferences expressed by an individual, or members of a particular group of persons, in relation to specified aspects of health status that are meaningful, in definable ways, for that individual or group (Till, 1992). • Quality of life is a state of well-being which is a composite of two components: 1) the ability to perform everyday activities which reflects physical psychological, and social well-being and 2) patient satisfaction with levels of functioning and the control of disease and/or treatment related symptoms (Gotay et al., 1992). • An individual’s perception of their position in life in the context of the culture and values systems in which they live and in relation to their goals, expectations, standards and concerns (WHO Quality of life Groups, 1993).
No clear definition because: • Many possible definitions • Multi-dimensionally • Subjective • Related to society • Researchers are free to choose • The notion of measuring the quality of life could include the measurement of practically anything of interest to anybody. And, no doubt, everybody could find arguments supporting the selection of whichever set of indicators to be his choice (Andrews & Withy, 1976, page 6)
No clear definition because: • Different origins of research • Clinical decision making: Does the patient benefit from the treatment? • Epidemiology (public health): what is the morbidity of the population? • Health economics: Is it worth the money?
Common items in definitions: • It is not the doctor who reports • Quality of life is subjective…. • “Given its inherently subjective nature, consensus was quickly reached that quality of life ratings should, whenever possible, be elicited directly from patients themselves. “ (Aaronson, in B Spilker (Ed): Quality of life and Pharmacoeconomics in Clinical Trails, 1996, page 180) • Reports between proxies and patients vary.
Common items in definitions: • Health related • Multidimensional • Physical, psychological, social • Questionnaires • Standardize questions and response • Reproducible results: sciences • Quantify subjectivity • Operational defined • Like IQ and temperature.
How to measure quality of life form a clinical point of view? • Choose items • Are you able to walk one kilometer ? • Do you feel depressed ? • Choose response mode • Binary yes / no • Multiple (Likert) yes / at bid / hardly / no • Continuous (Visual Analogue Scale) Always ————X—— Never • Combine items to dimensions of quality of life • Sum up the items belonging to one dimension • Rescale sum on a scale from 0 to 100
The problem of multidimensionality • What if outcome conflict • e.g: better mobility, but worse roll emotional • On has to weight or combine outcomes • What if some patients dies? • Cancer therapy • Better quality of life, but higher mortality • Weight quality of life with mortality
Time Without Symptoms of disease and subjective Toxic effects of treatment • TWiST • Developed by Gelber (statistician) • In search for a typical “cancer” problem • Often prolonged life but also a reductions in quality of life • At the beginning (side effects) • At the end • Only count the days without symptoms of disease and subjective toxic effects of the treatment
Time Without Symptoms of disease and subjective Toxic effects of treatment
TWiST ignores differences in quality of life • TWiST • Healthy = 1 • Sick (dead) = 0 • There is more to life than sick/health • Make scale 0..1 • Quality adjusted TWiST (Q-TWiST) • Q-TWiST = QALY • Quality Adjusted Life Year
QALY Analysis • Count life years • Value (V) quality of life (Q) • V(Q) = [0..1] • 1 = Healthy • 0 = Dead • One dimension • Adjusted life years (Y) for value quality of life • QALY = Y * V(Q) • Y: numbers of life years • Q: health state • V(Q): the value of health state Q • Also called “utility analysis”
Which health care program is the most effective? • A new cancer therapy • Quality of life = 0.7 • 1.5 year survival • QALY = Y x V(Q) • 1.5 x 0.7 • 1.05 QALY • The standard therapy • Quality of life = 0.8 • 1.0 year survival • QALY = Y x V(Q) • 1.0 x 0.8 • 0.8 QALY
How to measure QoL for the calculation of QALYs? • One needs a uni-dimensional value of quality of life • Like the IQ-test measures intelligence • Ratio or interval scale • Difference between 0 and .8 must be 8 time higher than .1 • Four popular methods have these pretensions • Visual Analog Scale • Time Trade-Off • Standard Gamble • Person trade-off
Value a health state • You are in a wheelchair • No pain or discomfort • No psychosocial problems
Normal health X Visual Analogue Scale • VAS • Also called category scaling • From psychological research • “How is your quality of life today ?” • “X” marks the spot • Response in centimeters • Rescale to [0..1] • Different anchor point possible: • Normal health (1.0) versus dead (0.0) • Best imaginable health versusworse imaginable health Dead
Time Trade-Off • TTO • Wheelchair • With a life expectancy: 50 years • How many years would you trade-off for a cure? • Max. trade-off is 10 years • QALY(wheel) = QALY(healthy) • Y * V(wheel) = Y * V(healthy) • 50 V(wheel) = 40 * 1 • V(wheel) = .8
Standard Gamble • SG • Wheelchair • Life expectancy is not important here • How much are risk on death are you prepared to take for a cure? • Max. risk is 20% • 100% life on wheels = (100%-20%) life on feet • V(Wheels) = 80% or .8
Comparisons of valuation methods (1) • Visual analogue scale • Easy • No trade-off: no relation to QALY • No interval proportions • Massive evidence • Much from other social sciences • Standard Gamble / Time trade-Off • Less easy • Trade-off: clear relation to QALY • Interval proportions • Much evidence • Especially in health economics
Comparisons of valuation methods (2) • Person Trade-Off • Difficult • Trade-off: unclear relation QALY • Include egalitarian aspects of health care • Unclear interval proportions • Very little evidence • Controversial results • Extreme value compression
Patient values seem high • Stensman • Scan J Rehab Med 1985;17:87-99. • Scores on a visual analogue scale • 36 subjects in a wheelchair • 36 normal matched controls • Mean score • Wheelchair: 8.0 • Controls: 8.3
Interpretation response shift • Thentest = true value • Saves trouble of pre-test • But….is the post-test still true? • Should we do a thenposttest as well? • Does this say that patient can not judge their own health?
All current patients Which patient should we ask? • Those with experience? • Who are they? • The amount of experience • Length of experience • Time since experience • Strength of relation with patient No experience Friends No time at all Family Some time Long Self Now recently distant never
Quality of life in patients • When should we ask? • Which patients should we ask? • Response shift • Is a low quality of life a sign of • a low physical functioning? • an absence of the response shift?
The incomprehensible patient • Keeps on coming back to the clinic • Modifies social environment • Passive in own goals • Angry, depressed, suspicious • Low quality of life
Adaptation and quality of life • A low quality of life sign of low adaptation • Increase adoption will increase quality of life • A starting point for psychological therapy • A low quality of life • Malfunctioning of adaptation • Wrong coping strategy • Behavioral / peer group therapy • Personality disorder • More invasive therapy