Download
1 / 15
150 likes | 280 Views
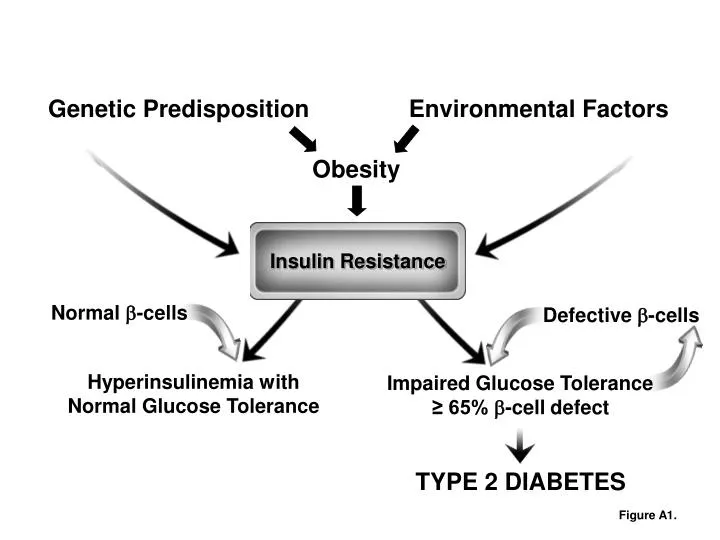
Insulin Resistance. Normal -cells. Defective -cells. TYPE 2 DIABETES. Genetic Predisposition. Environmental Factors. Obesity. Hyperinsulinemia with Normal Glucose Tolerance. Impaired Glucose Tolerance. ≥ 65% -cell defect. Figure A1. Minimal Model. Glucose levels.

E N D
Insulin Resistance Normal -cells Defective -cells TYPE 2 DIABETES Genetic Predisposition Environmental Factors Obesity Hyperinsulinemia with Normal Glucose Tolerance Impaired Glucose Tolerance ≥ 65% -cell defect Figure A1.
Minimal Model Glucose levels Insulin sensitivity (SI) Β-cell response Insulin levels Insulin injection Glucose injection Figure A2.
2500 Week 0 2000 Week 2 Week 4 1500 Week 6 Secretion 1000 500 0 0 1 2 3 4 5 6 7 8 Insulin Sensitivity Figure A4.
Insulin Resistance Figure A4 Figure A5 Cause of Hyperinsulinemia? Conventional wisdom: Increased fasting glycemia and/or impaired glucose tolerance Hyperinsulinemia (Increased secretion, Reduced clearance) Figure A5.
BASELINE 6 WKS FAT FEEDING 9.0 300 * Insulin * * 6.0 200 pM pM * 3.0 * 100 * GLP-1 * 0 0.0 125 4.0 Glucose ng/mL mg/dL 100 * 2.0 GH 75 0.0 8.0 * 1.0 * * FFA * * * * * * Cortisol * * 6.0 0.8 * * * 0.6 μg/mL 4.0 mM * 0.4 2.0 0.2 0.0 0.0 6am 9 12pm 3 6pm 9 12am 3 6am 6am 9 12pm 3 6pm 9 12am 3 6am Figure A6.
Insulin Levels 50 Plasma Lymph 40 30 Lymph Insulin (uU/ml) 20 10 10 8 0 Rd 6 Glucose Uptake 4 2 Glucose disposal 0 0 60 120 180 240 300 360 Time (minutes) INSULIN IN PLASMA AND INTERSTITIAL FLUID Hand-in-glove relationship between interstitial insulin and glucose disposal Figure A7.
Insulin injection INSULIN [μU/ml] Plasma Interstitial fluid INSULIN [μU/ml] Glucose uptake into cells GLUCOSE DISPOSAL [mg/kg per min] Figure A8.
INSULIN INSULIN 3.33 mU/min per kg 3.33 mU/min per kg LIVER OUTPUT UPTAKE 4 16 Rd 3 Glucose Flux (mg/min per kg) Glucose Flux (mg/min per kg) 12 2 8 1 4 0 HGO NHGO -1 0 0 30 60 90 120 150 180 0 30 60 90 120 150 180 Time (minutes) Time (minutes) Figure A9.
Transendothelial transport barrier Insulin FFA adipocytes GLUCOSE PRODUCTION Figure A11.
Week 0 Week 6 35 * * * * * * Dog 1 30 Body Weight (kg) 25 Dog 2 20 -2 0 2 4 6 Weeks on diet 1000 Dog 3 * 750 +110% Body Fat (cm3) * 500 Omental Dog 4 +115% 250 SubQ 0 Figure A12. Week 0 Week 6
TNF- PPAR G6Pase SREBP-1 IL-6 PEPCK Leptin HSL LPL SREBP1 Adiponectin FABP Visceral Fat Resistant Liver FFA Figure A13.
β3-blockade 0.4 0.3 0.2 0.1 0.4 Free Fatty Acids 0.3 0.2 0.1 0.4 0.3 0.2 0.1 Figure A14.
“Pulsatile Lipolysis” FFA “Constitutive Lipolysis” GH TSH, PTH ANP Glucocorticoids “intrinsic” Figure A15.