Download
1 / 27
270 likes | 421 Views
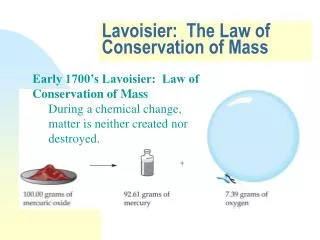
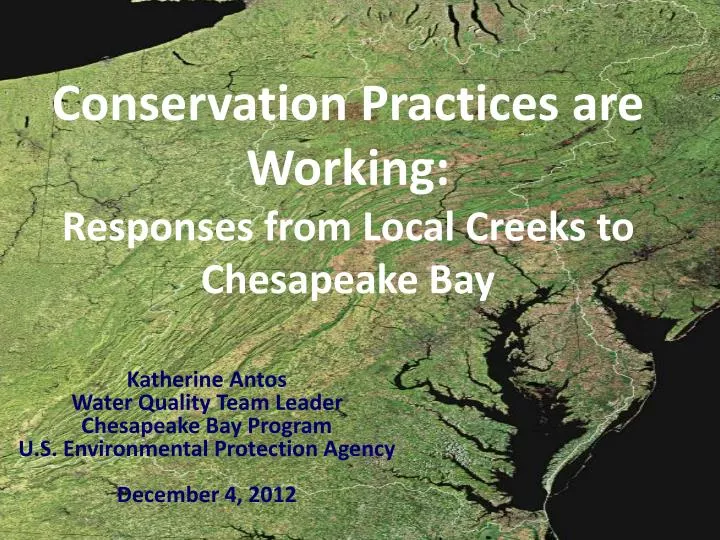
Conservation Practices are Working: Responses from Local Creeks to Chesapeake Bay. Katherine Antos Water Quality Team Leader Chesapeake Bay Program U.S. Environmental Protection Agency December 4, 2012. Watershed population has more than doubled since 1950.

E N D
Conservation Practices are Working: Responses from Local Creeks to Chesapeake Bay Katherine Antos Water Quality Team Leader Chesapeake Bay Program U.S. Environmental Protection Agency • December 4, 2012
Chesapeake Bay Watershed Monitoring Network • 120 stations in 2012 • Started with 31
Long-term • (1985-2010) • water quality monitoring stations in the Chesapeake Bay Watershed • 9 River Input Stations • 22 Upstream Stations
Flow-adjusted Total Nitrogen Trends at 31 sites—1985-2010 • 21 (68%) down • 2 up (6%) • 8 not significant (26%)
Flow-adjusted Total Phosphorus Trends at 31 sites—1985-2010 • 22 (71%) down • 4 up (13%) • 5 not significant (16%) • 13 down sites exceed 50% reduction
Flow-adjusted Total Sediment Trends at 31 sites—1985-2010 • 10 down (32%) • 7 up (23%; 5>50%) • 14 not sig. (45%)
2025 Planning Target Approximately 455 million pounds of nitrogen during the 2011 water year.
2025 Planning Target Approximately 48 million pounds in the 2011 water year.
Modeling Information Using Average Hydrology Approximately 267 million pounds nitrogen delivered to Bay in 2011
Modeling Information Using Average Hydrology Approximately 18.3 million pounds phosphorus delivered to Bay in 2011
Between 2000-2010, more than 15,000 sites were sampled and rated for biological integrity. Average stream health scores indicated 57% of sites in very poor or poor condition.
Data summarized by sub-watersheds indicate almost half of sub-watersheds are in fair condition. Degradation can be very localized
Chesapeake BayTidal Water Quality Monitoring Station Network • 178 Stations • 92 Segments
TN Annual Trends
TP Annual Trends
Chlorophyll-a Annual Trends
TSS Annual Trends
Water Clarity Annual Trends
Bottom DO Summer Trends
JHU and UMCES: Mid-late summer dead zones in deep channel leveled off and declining since 1980s due to management actions
Decreasing trends in water clarity have our Bay scientists questioning the causes
Long term increases in Bay grasses keep hitting glass ceiling— lack of improving clarity, hotter summers
This and previous adult abundance indicator show crab populations responding to good, baywide fishery management decisions since 2009 though annual variation
Overall population numbers solid; individuals show signs of less than quality habitats, food
Chesapeake Bay TMDL Based on 7 Watershed Implementation Plans
Katherine Antos 410-295-1358 antos.katherine@epa.gov www.chesapeakebay.net www.epa.gov/chesapeakebaytmdl