Download
1 / 1
10 likes | 147 Views
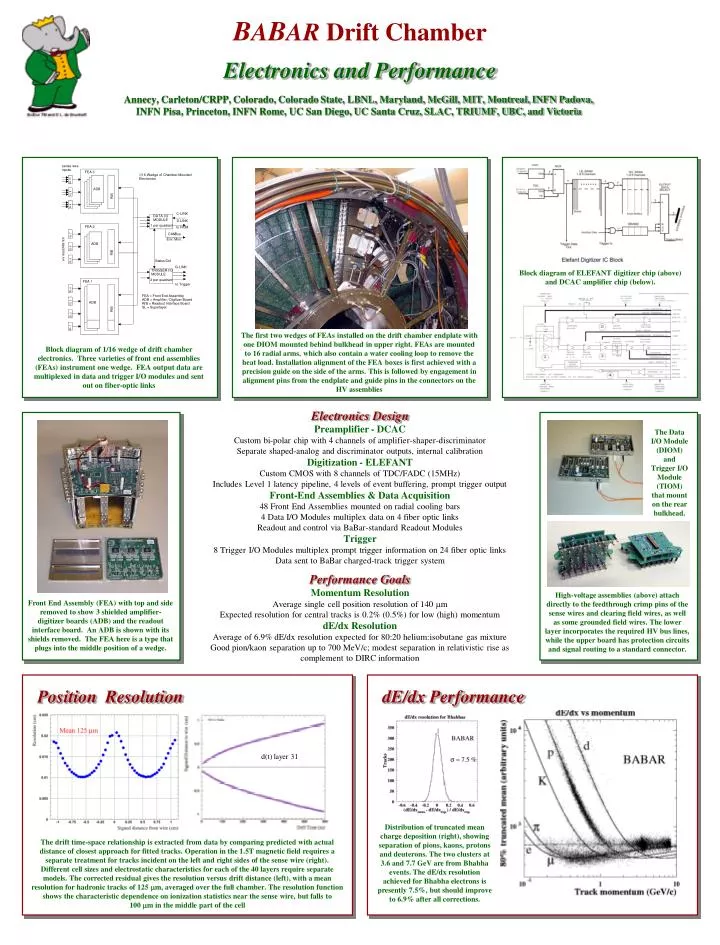
Block diagram of ELEFANT digitizer chip (above) and DCAC amplifier chip (below).

E N D
Block diagram of ELEFANT digitizer chip (above) and DCAC amplifier chip (below). The first two wedges of FEAs installed on the drift chamber endplate with one DIOM mounted behind bulkhead in upper right. FEAs are mounted to 16 radial arms, which also contain a water cooling loop to remove the heat load. Installation alignment of the FEA boxes is first achieved with a precision guide on the side of the arms. This is followed by engagement in alignment pins from the endplate and guide pins in the connectors on the HV assemblies Block diagram of 1/16 wedge of drift chamber electronics. Three varieties of front end assemblies (FEAs) instrument one wedge. FEA output data are multiplexed in data and trigger I/O modules and sent out on fiber-optic links The Data I/O Module (DIOM) and Trigger I/O Module (TIOM) that mount on the rear bulkhead. High-voltage assemblies (above) attach directly to the feedthrough crimp pins of the sense wires and clearing field wires, as well as some grounded field wires. The lower layer incorporates the required HV bus lines, while the upper board has protection circuits and signal routing to a standard connector. Front End Assembly (FEA) with top and side removed to show 3 shielded amplifier-digitizer boards (ADB) and the readout interface board. An ADB is shown with its shields removed. The FEA here is a type that plugs into the middle position of a wedge. dE/dx Performance d(t) layer 31 Distribution of truncated mean charge deposition (right), showing separation of pions, kaons, protons and deuterons. The two clusters at 3.6 and 7.7 GeV are from Bhabha events. The dE/dx resolution achieved for Bhabha electrons is presently 7.5%, but should improve to 6.9% after all corrections. BABAR Drift Chamber Electronics and Performance Annecy, Carleton/CRPP, Colorado, Colorado State, LBNL, Maryland, McGill, MIT, Montreal, INFN Padova, INFN Pisa, Princeton, INFN Rome, UC San Diego, UC Santa Cruz, SLAC, TRIUMF, UBC, and Victoria Electronics Design Preamplifier - DCAC Custom bi-polar chip with 4 channels of amplifier-shaper-discriminator Separate shaped-analog and discriminator outputs, internal calibration Digitization - ELEFANT Custom CMOS with 8 channels of TDC/FADC (15MHz) Includes Level 1 latency pipeline, 4 levels of event buffering, prompt trigger output Front-End Assemblies & Data Acquisition 48 Front End Assemblies mounted on radial cooling bars 4 Data I/O Modules multiplex data on 4 fiber optic links Readout and control via BaBar-standard Readout Modules Trigger 8 Trigger I/O Modules multiplex prompt trigger information on 24 fiber optic links Data sent to BaBar charged-track trigger system Performance Goals Momentum Resolution Average single cell position resolution of 140 mm Expected resolution for central tracks is 0.2% (0.5%) for low (high) momentum dE/dx Resolution Average of 6.9% dE/dx resolution expected for 80:20 helium:isobutane gas mixture Good pion/kaon separation up to 700 MeV/c; modest separation in relativistic rise as complement to DIRC information Position Resolution The drift time-space relationship is extracted from data by comparing predicted with actual distance of closest approach for fitted tracks. Operation in the 1.5T magnetic field requires a separate treatment for tracks incident on the left and right sides of the sense wire (right). Different cell sizes and electrostatic characteristics for each of the 40 layers require separate models. The corrected residual gives the resolution versus drift distance (left), with a mean resolution for hadronic tracks of 125 mm, averaged over the full chamber. The resolution function shows the characteristic dependence on ionization statistics near the sense wire, but falls to 100 mm in the middle part of the cell