Download
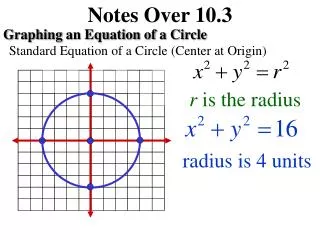
1 / 9
90 likes | 163 Views
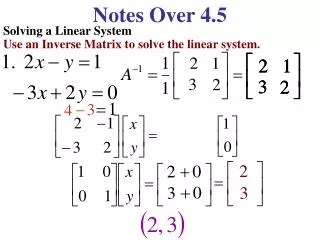
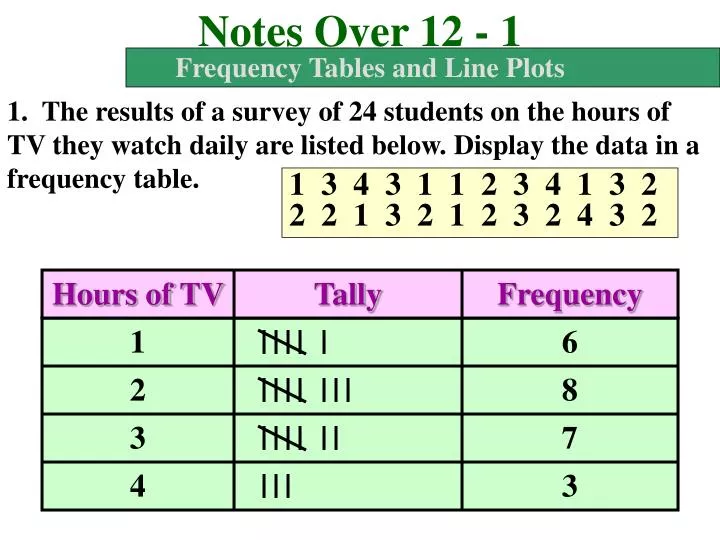
Notes Over 12 - 1. Hours of TV. Tally. Frequency. Frequency Tables and Line Plots. 1. The results of a survey of 24 students on the hours of TV they watch daily are listed below. Display the data in a frequency table. 1 3 4 3 1 1 2 3 4 1 3 2 2 2 1 3 2 1 2 3 2 4 3 2. 1.

E N D
Notes Over 12 - 1 Hours of TV Tally Frequency Frequency Tables and Line Plots 1. The results of a survey of 24 students on the hours of TV they watch daily are listed below. Display the data in a frequency table. 1 3 4 3 1 1 2 3 4 1 3 2 2 2 1 3 2 1 2 3 2 4 3 2 1 6 2 8 3 7 4 3
Notes Over 12 - 1 1 2 3 4 5 6 7 8 Frequency Tables and Line Plots 2. The results of a survey of 15 students, on the number of miles from home to the mall are listed below. Display the data in a line plot. Then find the range. 2 4 3 7 3 1 4 2 2 6 3 5 1 8 3 Range - the difference between the greatest and least Range = 8 - 1 = 7
Notes Over 12 - 1 Number 10 15 20 25 30 35 40 45 Frequency Frequency Tables and Line Plots 3. Construct a frequency table from the line plot. 10 15 20 25 30 35 40 45 1 2 0 3 1 4 2 1
Pg. 610 #1-5, 6 – 23 Frequency Tables and Line Plots Display each set of data in a frequency table. 1. 1 4 0 3 0 1 3 2 2 4 DATA Tally Frequency 0 2 1 2 2 2 3 2 4 2
Pg. 610 #1-5, 6 – 23 Frequency Tables and Line Plots Display each set of data in a frequency table. 2. 6 2 8 7 9 3 5 4 8 2 4 6 4 1 DATA Tally Frequency 0 – 1 1 2 – 3 3 4 – 5 4 6 – 7 3 8 – 9 3
Pg. 610 #1-5, 6 – 23 0 1 2 3 4 Frequency Tables and Line Plots Display each set of data in a line plot. Find the range. 3. 0 2 1 1 4 0 4 3 2 Range = 4 - 0 = 4
Pg. 610 #1-5, 6 – 23 0 1 2 3 4 5 Frequency Tables and Line Plots Display each set of data in a line plot. Find the range. 4. 5 0 2 1 4 3 4 0 2 5 4 3 2 0 4 Range = 5 - 0 = 5
Pg. 610 #1-5, 6 – 23 Frequency Tables and Line Plots Describe a set of data that would be easier to display with a frequency table than with a line plot. Data obtained from items other than numbers. Example: Frequency of people with different eye color.
Pg. 610 #1-5, 6 – 23 Frequency Tables and Line Plots