Download

1 / 21
210 likes | 362 Views
Retail Sales Allocation Presentation of Methodology Draft. April 12, 2012 Bob Stull & Justin Larson - PECI. Agenda. Why did BPA contract this work? Why retail allocations? What are retail allocations? Research components Stakeholder interviews, product profiles, retail profiles

E N D
Retail Sales Allocation Presentation of Methodology Draft April 12, 2012 Bob Stull & Justin Larson - PECI
Agenda • Why did BPA contract this work? • Why retail allocations? • What are retail allocations? • Research components • Stakeholder interviews, product profiles, retail profiles • Anatomy of an allocation • 3 primary components • Roadmap to results • Going from inputs to outputs 1
Why did BPA contract this work? Stakeholders asked for an approach to allocations that is: • Defensible to regulators and evaluators • Transparent and well-documented • Available to all types of utilities • Applicable to a wide array of uses • Flexible enough to adapt to specific needs 2
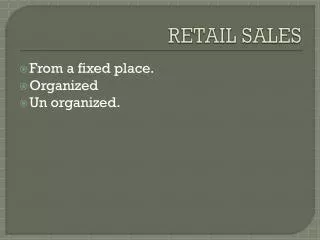
Retail Sales Allocation: Why • Upstream incentive models are cost effective • Give small utilities accessto upstream models • Estimate leakage (prior to evaluation) • Control savings adjustmentsfrom evaluation • Choose most equitable locationsto include in programs • More targeted and/or effective marketing 3
Retail Sales Allocation: What What we know: • Some ## people are walking these aisles buying EE products • All ## are walking out the door and installing in a utility territory nearby What we want to know: • How many of ## are going to which nearby utility territories *graphics are for illustrative purposes only, and do not represent real market data 4
Retail Sales Allocation: What NOT Projections • Allocations do not predict sales volumes Estimate Market Share • Allocations are impartial to competing stores Predict stores’ consumer mix, not store choices • Allocations model the mix of people likely to be in a store, not which retailer a consumer will choose over another 5
Considerations Topography mixes it up • A distance ring is not good enough 6 mile ring drawn around a Walmart in Pasco, WA *graphics are for illustrative purposes only, and do not represent real market data 6
Considerations Distance is measured in time Area in blue represents 10 minutes of drive time from the same store. Notice all the populated areas that are within the ring but not within the drive time. *graphics are for illustrative purposes only, and do not represent real market data 7
Considerations Situation: Two grocers share a parking lot Consideration: Would they have the same CFL allocation? Answer: Maybe. • Different retailers have unique customer mixes • Makeup of households within the trade area matters, not just how many there are • Segmentation identifies core customers for a retailer • Allocations may be different depending on if core customers are blue or red *graphics are for illustrative purposes only, and do not represent real market data 8
Considerations Situation: I would drive a lot farther to buy a large appliance than I would to buy a CFL. • Consideration: Shouldn’t the allocation methodology reflect this behavior? • Answer: Yes. • Some products naturally draw from larger trade areas • One location may have multiple trade area definitions *graphics are for illustrative purposes only, and do not represent real market data 9
Considerations Situation: A single retailer has locations in dense urban areas as well as isolated small towns Consideration: Will both stores have the same trade area? Answer: No. • Urban density plays a role in allocations with regard to trade area sizing 10
Considerations Situation: Utility territories don’t conform to any administrative geography. Consideration: Isn’t there a lot of utility “overlap”? Answer: Yes. • Utilities territories are not exclusive areas on a map • Utilities are matched to zips they serve • Methodology will model distribution of households in shared zip codes 11
Allocation Mechanics How the parts fit together
Anatomy of an Allocation Incentive Redemption 1 Mosaic Segmentation Retail Purchasing Census Topographic Demographic Geographic Psychographic Simmons Green Aware Profile Market Profile Consumer Profile Retail Intelligence Customer Intelligence Consumer Trade Area 2 Retailer Profile Utility Boundary Profile 3 PECI Market Intelligence 4 Location Scorecard Allocation Profile Calculates % attributable to each utility 12
Roadmap to Results 1 Market Profiles Create trade area assumptions • Compare purchase locations to install sites to establish transactional drive times (program data) • Compare distance between locations within each chain in relation to each other (no program data) • Create drive-time assumptions for retailers’ trade areas • 3 components to each trade area: • Product Type • Retailer Type • Urban Density 13
Roadmap to Results 2 Retailer Profiles Create Mosaic Segmentation Profiles for each retailer • Analyze segmentation within retail trade areas 14
Roadmap to Results 3 Location Scorecard Count Households within trade area • By segment • By zip code • Dominant Mosaic segments get double weighting • Simmons GreenAware profile segments get double weighting 15
Roadmap to Results 4 Allocation Divide scores between utilities • Weight utility scores where there are multiple utilities • Weight utility scores for municipal 16
Retail Profile Dominant Households • All Households • GreenAware Households 250 250 250 300 300 30 30 30 1250 Zip Code Boundaries 10 10 125 15 15 15 45 45 45 5 5 350 350 50 1000 10 Minute Trade Area Utility A (900 / 3430) = 26% Utility B (1667.5/ 3430) = 49% Utility C (862.5 / 3430) = 25% Retailer 1800 Utility A = 900 Utility B = 900 165 Utility C = 165 Total Trade Area Score = 3430 70 Utility B = 70 1395 Utility B = 697.5 Utility C = 697.5 17
Questions, comments, follow-up:Sarah F. Moore, BPA Residential Sector Lead sfmoore@bpa.govBob Stull, PECI Sr. Oversight bstull@peci.orgJustin Larson – PECI Business Intelligence Analyst jlarson@peci.org