Download
1 / 12
130 likes | 346 Views
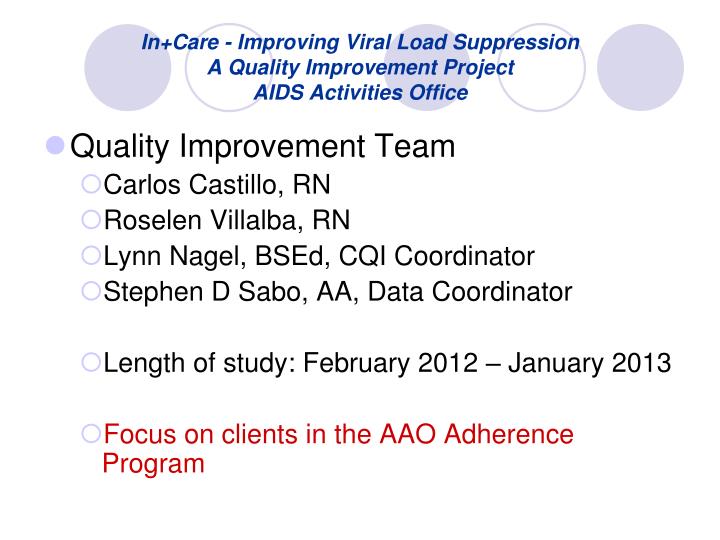
In+Care - Improving Viral Load Suppression A Quality Improvement Project AIDS Activities Office. Quality Improvement Team Carlos Castillo, RN Roselen Villalba, RN Lynn Nagel, BSEd, CQI Coordinator Stephen D Sabo, AA, Data Coordinator Length of study: February 2012 – January 2013

E N D
In+Care - Improving Viral Load SuppressionA Quality Improvement ProjectAIDS Activities Office • Quality Improvement Team • Carlos Castillo, RN • Roselen Villalba, RN • Lynn Nagel, BSEd, CQI Coordinator • Stephen D Sabo, AA, Data Coordinator • Length of study: February 2012 – January 2013 • Focus on clients in the AAO Adherence Program
Background Information/Rationale for QI Project • Clients missing doses of medication can lead to resistance • Lowering of one’s viral load shows responding to treatment and following medication regiment • Clients in the adherence education program will show a increase in viral load suppression. • Overall in 2007, 64% of AAO clients had a suppressed viral load. In 2011, the percentage was 74.
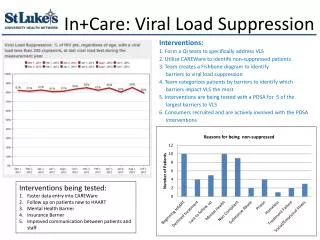
Performance Measure • In+Care 4: Percentage of clients with HIV infection whose last viral load in the measurement year is less than 200 copies
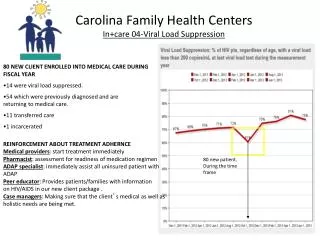
In Care -Baseline Data • VL Suppression – Below 200 • All AAO clients • Year 2011 – 528/711 = 74% • Clients in Adherence program • Year 2011 – 118/194 = 60% • Clients in adherence program • November 1, 2011 – January 31, 2012 = 84 clients were enrolled in the adherence program. 56% (47/84) had a viral load of <200 • Clients are referred to adherence program by physicians
PDSA – Plan/Do (First Quarter) • Create flow diagram and review adherence process • Create cause diagram and review with team • Classification of clients in program, long term / short term • Frequent adherence appointments will be scheduled as needed • Frequent follow up phone calls • Review list of clients on adherence & remove those that no longer need to be in program, lost to follow-up, moved, etc and removed these clients from active list • Run monthly reports with VL’s for adherence nurses to monitor • Interventions specific to individual clients needs that are in the Adherence Program • Will help pay co-pays for clients • Provide transportation assistance – bus passes or taxi vouchers
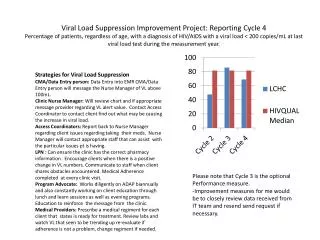
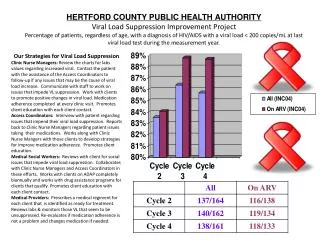
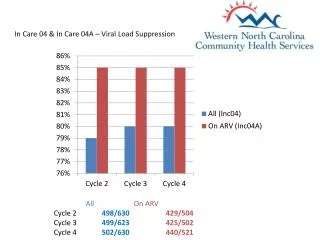
PSDA - Study/Results (First Quarter) • All AAO clients • Overall there was an increase in the number of clients with a viral load <200 to 77% (510/727) – April 30, 2012 • For 2011 74%(528/711) of clients had a viral load <200 • Incentives and perseverance on part of the adherence nurses have shown an increase in the number of clients with a viral load <200.
PSDA - Study/Results (First Quarter) • Clients in Adherence Program – Feb 1 – April 30, 2012 • 92 clients were enrolled in the adherence program. 62% (57/92) had a viral load of <200 • 10 clients received transportation vouchers. 60% (6/10) had a viral load of <200 • 23 clients received co-pay assistance. 61% (14/23) had a viral load of <200 • 2 clients received both transportation & co-pay assistance. 0% (0/2) had a viral load of <200 • 57 clients did not receive any incentives. 61% (35/57) had a viral load of <200
Months in Program VL <200 New – 2 months 23% (21/92) 3 months – 5 months 24% (22/92) > 6 months 15% (14/92) VL > 200 New – 2 months 20% (18/92) 3 months – 5 months 11% (10/92) > 6 months 8% (7/92) PSDA - Study/Results (First Quarter)
PDSA – Act (Second Quarter) • Next step: continue with paying co-pays, transportation needs, frequent visits & phone calls • Design a bulletin board for visual reinforcement in the clinic on the importance of medication adherence • Closely monitor “long term” clients for any adherence issues • Compare 3 month data with 6 month data looking for trends