Download
1 / 16

E N D
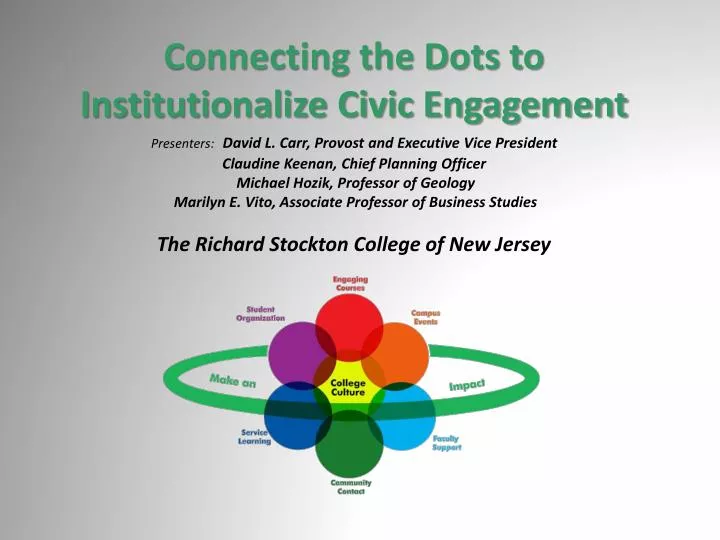
Connecting the Dots to Institutionalize Civic EngagementPresenters: David L. Carr, Provost and Executive Vice PresidentClaudine Keenan, Chief Planning Officer Michael Hozik, Professor of Geology Marilyn E. Vito, Associate Professor of Business Studies The Richard Stockton College of New Jersey
Using Data at Your Fingertips In their book At Your Fingertips: Everyday Data to Improve Schools, Levesque etal recommend that educators assess four considerations: • The numerical form each indicator will take • Details of who, what and when to measure • Whether to measure attainment or gains • What comparisons to make among subpopulations
Considering Indicators for Stockton • The numerical form each indicator will take • Counts, averages, percents or ratios? • Begin with simple counts, then analyze for patterns • Details of who, what and when to measure • Number of students who attend political engagement events • Number of faculty who encourage attendance • Pilot for Major events, supporting events, Fall 2009: • Freshmen Convocation • Constitution Day with Eugene Robinson • Constitutional Rights with Ryan Clark • Fannie Lou Hamer Symposium
Considering Indicators for Stockton • Whether to measure attainment or gains • Number of “repeat students” at multiple events • Baseline GPA, number of credits attempted/earned • Set up for gains: year-over-year major events, for example • What comparisons to make among subpopulations • Residential v. Commuter status • Class level: Freshman, Sophomore, Junior, Senior • Admission Type: FTFTF or Transfer • Credit Loads: Part/Full Time • School/Major (students and faculty)
Procedure • Faculty identified as teaching a course that one of the attending students was taking • Contacted faculty and asked how they promoted the event • A = Did not mention it • B = Only announced it • C = Announced & encouraged attendance • D = Gave Extra Credit • E = Met a course requirement • F= Attendance was required • Divided # of students associated with each faculty memberby the # of faculty who gave a particular response
Faculty Promotion Conclusions • The 2 most reliable ways to insure student attendance • Require attendance at a specific event • Make attendance at a specific event one way to meet a course requirement • With the exception of the Constitution Day Event, just giving extra credit was less effective • Simply announcing an event, even with encouragement to attend is not sufficient
Technical Setup • Student OneCard (Magnetic Stripe) ID • Laptops at registration, peripheral swipe device • Export .csv file of ID numbers (from magnets) • Import to Banner (Discoverer reporting) • Extract demographic data • Residential • Credits/GPA/Major • Faculty
For More Information • Political Engagement Web Site: http://intraweb.stockton.edu/eyos/page.cfm?siteID=14&pageID=133 • david.carr@stockton.edu • claudine.keenan@stockton.edu • michael.hozik@stockton.edu • marilyn.vito@stockton.edu