Download
1 / 4
160 likes | 774 Views
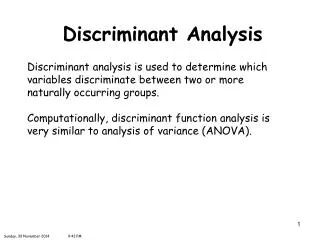
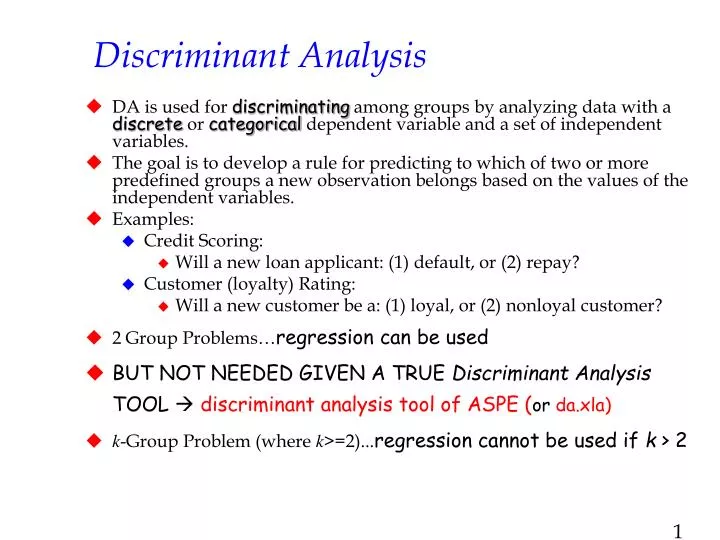
Discriminant Analysis. DA is used for discriminating among groups by analyzing data with a discrete or categorical dependent variable and a set of independent variables.

E N D
Discriminant Analysis • DA is used for discriminating among groups by analyzing data with a discrete or categorical dependent variable and a set of independent variables. • The goal is to develop a rule for predicting to which of two or more predefined groups a new observation belongs based on the values of the independent variables. • Examples: • Credit Scoring: • Will a new loan applicant: (1) default, or (2) repay? • Customer (loyalty) Rating: • Will a new customer be a: (1) loyal, or (2) nonloyal customer? • 2 Group Problems…regression can be used • BUT NOT NEEDED GIVEN A TRUE Discriminant Analysis TOOL discriminant analysis tool of ASPE (or da.xla) • k-Group Problem (where k>=2)...regression cannot be used if k > 2
Good students Weak students • where • X1 = GPA • X2 = GMAT score Cutoff value 2-group DA example • Study “the MBA program admissions” end of chap. problem #5. • Faculty rate applicants as (1) good students or (2) weak students. • Undergraduate GPA and score on GMAT are “thought to be “ helpful in this process.
Multiple discriminant analysis • k-group DA, study end of chap. problem #11 • Compute the distance from the point in question to the centroid of each group and assign it to the closest group. • Euclidean Distance (which does not account for possible differences in variances). • When we adjust for possible differences in the variances we get: • However, an improved variation of the above, known as Mahalanobis distance measure, further refines it to account for differences in the covariances between the independent variables. • Mahalanobis distance measure is implemented in the DA tools (such as ASPE) • Suggested problems: #6, 7, 10
CapitalUno Credit cards (Text Case) CapitalUno (CU) is one of the largest credit card issuers in the United States. CU uses television commercials and direct mail as its primary means of offering cards to potential customers. CU spends millions of dollars each year on the postage and printing costs associated with its direct mail marketing efforts. Throughout the industry, the response rate to direct mail solicitations is notoriously low. As a result, CU could drastically reduce the cost and increase the effectiveness of its direct mail marketing efforts if it could do a better job of predicting who will and will not respond to its credit card solicitations. Firms in the financial services industry often share information with each other about the demographic and financial attributes of their customers. Using this information, CU created and maintains a massive database for its direct mail activities. Each record in the database contains detailed data about each household in their coverage area. Thus, in addition to the family name and address at each household, CU has information about the number of people in each household, the family income level, the number of cars the family owns, and the number of bank credit cards held by each family. CU wants to use this information to develop a predictive model for whether or not a household will respond positively to a direct mail solicitation. As an experiment, CU sent credit cards offers to 20 households. The data found in the file CapitalUno.xls summarizes the demographics and response to the solicitation for each household. A response value of 1 indicates the household did not respond, whereas a 2 indicates the acceptance of the credit card offer.