Download
1 / 24
240 likes | 343 Views
SAOZ NO x and Lightning J. P. Pommereau and F. Goutail. Ground-based SAOZ in Bauru since 1995 Short duration small balloon flights MIR long duration flights Modelling Further work.

E N D
SAOZ NOx and Lightning J. P. Pommereau and F. Goutail Ground-based SAOZ in Bauru since 1995 Short duration small balloon flights MIR long duration flights Modelling Further work
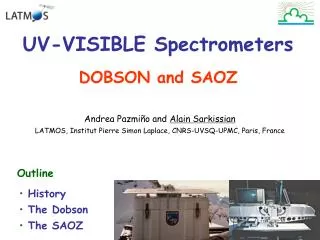
SAOZ Spectrometer at IPMet in Bauru since 1995Network for Detection of Stratospheric Change (NDSC) complementary station
NO2 evening columns above BAURU • Most important parameters • Season • Small influence ENSO and QBO (10 hPa) • No influence of Solar flux and Kp • Average Residual <0.001%, max 4%
NO2 evening columns above BAURU 95 96 97 98 99 00 01 02 03
2001 2003
NOy mid-lat ? Local prod by blue-jets ? MIR-SAOZ 2004 Lightning ? (larger NO2 in the morning ?)
NO2 MIR-SAOZ 2001 20°S % deviation from zonal mean Correlated with O3 STE ? ? Maximum in UT over continental convection Minimum over Maritime areas
MOZART Modelled lightning and NOx production at the Equator JFM (NOx production over continental convection only)
Lightning Imaging Sensor onboard TRMM (DJF) Continental and Maritime convection of different nature
NO2 MIR-SAOZ 2003 20°S % deviation from zonal mean ? Correlated with O3 STE ?
MIR-SAOZ 2003 High lightning activity at launch
NOy mid-lat ? Local prod by blue-jets ? MIR-SAOZ 2004 Lightning ? (larger NO2 in the morning ?)
2004 20 km max but at diff loc ? As 2001 and 2003 UT / TTL Low over maritime convection (as 2001) High over Africa (as 2001) Limited over South America (less than 2001)
12-14 March MIR over Africa High Lightning activity
20-23 March MIR over Amazonia Low Lightning activity
Summary NO2 Sources (I) Local production vs transport Removal of H transport by PV correlation Production by lightning in UT and TTL Maximum column onn strong lightning days Maximum up to 200 ppt at 15 km , 100 ppt at 12 km highly correlated to lightning activity over continental convective areas Minimum 10-20 ppt over maritime convective areas Further work MIR Correlation with LIS flashes during 5 days prior to MIR overpass How much NOx produced by lightning: comparison to model simulations, ajustment of parametrisation. LMDz / TOMCAT modelling in progress over Bauru as well as at MIR location
Summary NO2 Sources (2) Max NO2 0.2-0.3 ppb at 20-22 km at longitude depending on year STE ? Local production in LS by blue-jetsfollowed by QBO dependent transport ? Further work Characterisation: Source in Reprobus and Mimosa Chem ? Mechanism: MIPLASMO box trajectory ?