Download
1 / 25
250 likes | 401 Views
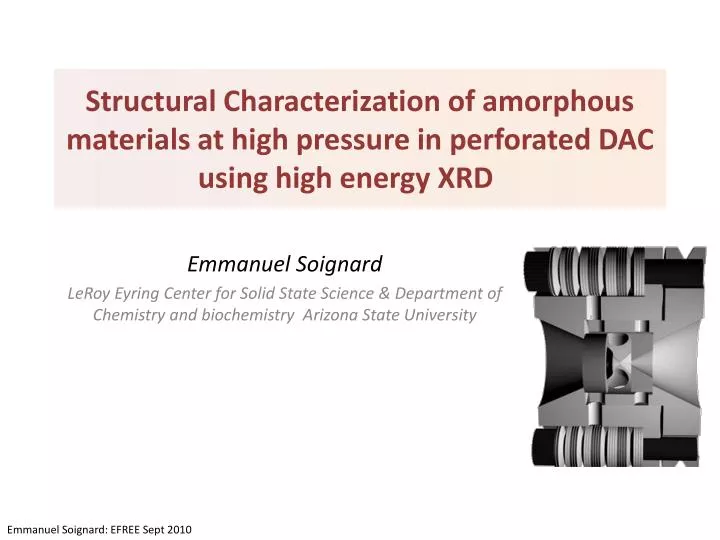
Structural Characterization of amorphous materials at high pressure in perforated DAC using high energy XRD . Emmanuel Soignard LeRoy Eyring Center for Solid State Science & Department of Chemistry and biochemistry Arizona State University. Structural characterization of bulk glasses.

E N D
Structural Characterization of amorphous materials at high pressure in perforated DAC using high energy XRD Emmanuel Soignard LeRoyEyring Center for Solid State Science & Department of Chemistry and biochemistry Arizona State University
Structural characterization of bulk glasses • X-ray scattering • High energy • Thin walled capillary / little background compared to signal • Necessary corrections: • Atomic Form factor scattering intensity drops dramatically with Q • Need very accurate background corrections particularity at high Q • Need high energy X-ray source to achieve the highest Q range. Combination of X-ray and Neutron example from Barnes et al. JP-CM 1998 • Neutron scattering • Scattering cross-section not related to Z, possibility for isotopic substitutions to determine partial pair distribution function • Need for very large samples (~1-10 mm)
Amorphous/glass structure determination at high pressure • Raman Spectroscopy • Very easy experiment (non metallic) • Large pressure range accessible • Limited direct information / interpretation often difficult • Neutron scattering • High quality/resolution, large Q • Need large samples / limits the pressure range • New developments at IPNS (mm size samples) • High energy X-ray scattering • Large pressure range accessible • Easy for High Z materials • Large diamond background • X-ray scattering difficult for weakly scattering materials Durben and Wolf PRB 1991 Guthrie et al. PRL 2004
Perforated DAC/Applications Mössbauer spectroscopy Dadashev et al. RSI 2001 Pair distribution / high energy Parise et al. J. synchrotron Rad 2005 XAFS at low energy Bassett et al. Z. Kristallogr. (2000) High energy Low energy
What can be done to improve X-ray scattering on light element systems? 500 mm • Maximize sample volume (work in progress) • Better gasket design ( composites) (Sato et al.) • Drilled diamond culets • Remove the diamond material in the X-ray beam path • Dramatically decrease the background intensity • Used by several groups • Typically very large opening of the diamond weakens the anvil.
Perforation 300 mm 500 mm • Purchased from Almax Industry • Need to specify very narrow opening in order to maintain as much of the structural integrity. • Anvil support: critical to avoid splitting of the anvil: • Next to attempt using the Boehler-Almax design of backing plate and anvils good compressive anvil support very wide opening.
Double perforation / tradeoffs 4 mm 300 mm B2O3 glass in DAC with 2 perforation. (Experiment up to 17.2 GPa) • Difficulty to perfectly align the DAC • Difficulty to visually observe the sample • Perforation not transparent
How low Z can we go? Data outside the DAC from Sampath et al. J. Chem Phys. 2003 Amorphous BeH2 in DAC at room pressure not corrected for atomic form factors Very weak and noisy data Numerous artifacts (gasket, diamond) Difficult correction Compares well to the bulk sample X-ray scattering data
XRD Experiment • Single perforated diamonds • High energy • 80 keV • 100 keV • Packed sample (no pressure medium) • Pressure determined by ruby fluorescence
SiO2 Glass at high pressure • Dramatic decrease of the intensity above 27 GPa. • Intensity recovered below 12 GPa. • Previously reported by Hemley et al. PRL 1986 • Interpretation • 4 – 6 Si-O coordination change >27 GPa • 6 – 4 Si-O coordination change < 11 GPa • Original ED-XRD from Meade at al.: • Si-O distance consistent with 4 -6 coordination change
SiO2 Glass at high pressure Background Diffraction pattern Background subtracted Example of analysis:
SiO2 Glass at high pressure • <15 GPa:Compression of cages surrounding open regions of the glass • > 15 GPa: new peak / SiO6
SiO2 Glass at high pressure Si-O Si-Si O-O Red: compression Blue: decompression Open symbols: crystal data Green: Meade et al. PRL 1992 T Sato and N Funamori. PRL 2008 (star)
SiO2 Glass at high pressure Coordination determined using - density from T. Sato and N Funamori • - Tetrahedral first shrink up to 15 GPa • Change in coordination not as sharp as in calculations / 10 GPa of from Tse et al. • - Only clearly reach 6 fold coord. Above 40 GPa. Green: JS Tse et al. PRB 1992 (diamonds) T Sato and N Funamori. PRL 2008 (star)
Forsterite / Mg2SiO4 Glass Large component of the Earth mantle. Mg2SiO2much lower viscosity at meting point than SiO2 (Lacks et al. MD) Glass synthesis by Chris Benmore using CO2 laser heating on a levitator Raman: continuous change (S-H Shim, K. Catalli (2009) consistent with DJ Durben, PF McMillan and GH Wolf (1993)) Dimerization of the SiO4tetrahedra. No peak appear around 850 cm-1 / not like MgSiO3. not SiO6 MD model of the Mg-O network in Mg2SiO4Kohara et al. Science (2009)
Mg2SiO4 Glass Liquid Mg2SiO4 2 different runs on sector 1 APS Adjaoud et al. Chem. Geol. 2008
Mg2SiO4 Glass Edge shared? Waiting on the EoS measurement to determine coordination numbers
Amorphous red Phosphorous • Crystallized by 12.7 GPa (~8 GPa) • FSDP drops in intensity • short range structure shows little change • By 5 GPa 2nd nearest neighbor gets significantly closer, more structure in the medium range • followed by crystallization
Raman study of red P at high pressure Packed Hydrostatic • Low Laser power • 785 nm laser • Lose signal by 8 GPa • Consistent results for packed and hydrostatic compressions • reasonable to apply a hydrostatic equation of state to the packed sample data
Amorphous to crystalline: red to black phosphorus • Equations of state optically measured: • need to have a hydrostatic medium • not possible above 10-14 GPa • (quasi hydrostatic not sufficient) • need thin sample • need well defined edges • trick for clear samples • Sputter coating RP 9.5 GPa decompressed
Other phosphorus rich systems • P8Se2: • no Raman signal above 1 GPa (band gap closed)
Summary • Perforated DAC technique • Low background • Dramatic improvement to low Z amorphous • Applications to even crystals • E.g. can be used when in doubt amorphous phase could be present along with crystal • Equation of state using simple optical imaging technique • Used for P and show clear phase transition • Used for other systems like BeF2, As2O3 • Can use pentane- isopentane to ~7 GPa for hygroscopic samples • Working on measurement of Mg2SiO4 • Pressure induced crystallization in P-X systems • Still a rare phenomenon
Acknowledgements • Collaborators: • Jeff L. Yarger • Chris J. Benmore • Malcolm Guthire • Martin C. Wilding • J.K.R. Weber • Funding: • CDAC • Efree • Students: • SamratAmin • Erin Oelker • Keri McKiernan