Download
1 / 11
160 likes | 582 Views
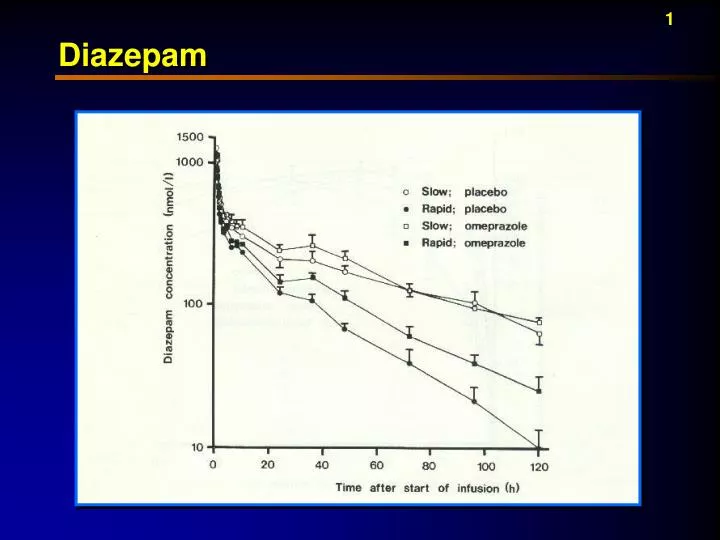
Diazepam. Drug-Drug Interaction Studies — Phenytoin. Drug. Oral. Change. Change. Change in. Study. dose. omeprazole. in CL. in AUC. C. ss. Population (#). (mg). dose (mg). (%). (%). (%). Healthy subjects. 250 (iv). 40 x 7. -. 15. -. -. (n=8). days. Healthy subjects.

E N D
Drug-Drug Interaction Studies — Phenytoin Drug Oral Change Change Change in Study dose omeprazole in CL in AUC C ss Population (#) (mg) dose (mg) (%) (%) (%) Healthy subjects 250 (iv) 40 x 7 - 15 - - (n=8) days Healthy subjects 300 40 x 7 - +19 - (n=10) days Healthy subjects 4.5 /kg 40 x 3 - NC - (n=18) days Epileptic patients ss 20 x 21 - - NC (n=8) days
Patient # Week 0 Week 1 Week 2 Week 3 Week 4 Week 5 Week 6 Week 7 Individual and Mean Plasma Concentrations (mol/L) of Phenytoin Omeprazole Treatment20 mg for 21 days 1 40.1 41.2 44.9 33.5 36.8 37.5 44.8 40.3 2 33.8 30.0 35.7 29.4 35.7 45.6 45.7 28.6 3 32.3 27.4 33.0 34.6 33.4 40.7 45.9 36.6 4 29.5 26.3 25.1 22.5 23.9 23.5 26.4 22.5 5 54.0 54.0 69.0 76.0 75.0 68.0 71.0 66.0 6 42.0 36.0 40.4 34.8 32.4 43.6 40.5 30.4 7 51.0 58.0 64.0 53.0 51.0 51.0 52.0 59.0 8 64.0 70.0 75.0 77.0 87.0 73.0 76.0 83.0 Mean 43.3 42.9 48.4 45.1 46.9 47.9 50.3 45.8
Drug-Drug Interaction Studies — Warfarin Drug Oral Change Change Change Study dose omeprazole in CL in AUC in C ss Drug Population (#) (mg) dose (mg) (%) (%) (%) Warfarin - R Healthy 4.7 20 x 14 - - +12 Warfarin - S subjects days NC (n=21) Warfarin - R Anticoag. ss 20 x 21 - - +9.5 Warfarin - S Patients days NC (n= 28)
Variability in Coagulation with Warfarin 15 10 5 Delta: Week 1 - Week 2 0 -5 -10 -15 0 5 10 15 20 25 TT Values at Week 1
Interaction Between Omeprazole and Warfarin in Anticoagulant Patients
Summary Table Drug-Drug Interaction Studies (cont’d)Effect of Omeprazole on the Pharmacokinetics of Other Drugs
Food Effect on MUPS AUC* (mol x h/L) 0.81 (0.64-1.01) 0.81 (0.65-1.02) 1.00 (0.84-1.18) Cmax* (mol/L) 0.38 (0.29-0.49) 0.57 (0.43-0.74) 0.66 (0.51-0.86) tmax** (h) 3.6 (1.0) 2.0 (1.0) -- Parameter FedMUPS Tablet FastingMUPS Tablet Fed/Fasting AUC = area under the plasma concentration versus time curve; Cmax = maximum observed plasma concentration; tmax = time of observed Cmax; MUPS = multiple unit pellet system * Geometric mean (95% confidence interval); ** Arithmetic mean (standard deviation); h = hours; Data from study SH-OME-008
Controlled Study of Intermittent Regimen Treatment with Omeprazole • Prognostic Factors for success with intermittent regimen treatment: • Symptoms controlled at 2-weeks is a powerful prognostic factor (p<0.0001) • 33% of patients who responded to 2-weeks of therapy required no further treatment • Other factors had no significant effect • Grade of esophagitis at entry (p=0.59) • Duration of reflux symptoms (p=0.39) • Body mass index (p=0.26) • Presence of H. pylori (p=0.63) • Gender (p=0.48) • Age (p=0.54) • Bardhan et al., BMJ, 1999