Download
1 / 19
200 likes | 337 Views
DARPA RE-NET Program Review 12-13 February 2014 Big Data Archive for EEG Brain Machine Interfaces. Iyad Obeid and Joseph Picone The Neural Engineering Data Consortium Temple University. Program Overview and Approach .

E N D
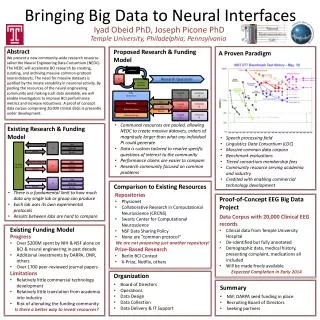
DARPA RE-NET Program Review12-13 February 2014Big Data Archive for EEG Brain Machine Interfaces Iyad Obeid and Joseph Picone The Neural Engineering Data ConsortiumTemple University
Program Overview and Approach • Goal: Release 20,000+ clinical EEG recordings from Temple University Hospital (2002-2013) • Includes physician EEG reports and patient medical histories • Three tasks: • Software Infrastructure and Development: • convert data from proprietary formats to an open standard (EDF) • Data Capture: • copy files from 1500+ CDs and DVDs • Release Generation: • Deidentify data • Resolve physician reports and EEGs • Clean up data
The Clinical Process • A technician administers a 30−minute recording session. • An EEG specialist (neurologist) interprets the EEG. • An EEG report is generated with the diagnosis. • Patient is billed once the report is coded and signed off.
Task 1: Software and Infrastructure Development Major Tasks: • Inventory the data (EEGs and physician reports) • Develop a process to convert data to an open format • Develop a process to deidentify the data • Gain necessary system accesses to the source forms of the reports Status and Issues: Efforts to automate .e to .edf conversion failed due to incompatibilities between Nicolet’s NicVue program and ‘hotkeys’ technology. Accessing physician reports required access to 5 different hospital databases and cutting through lots of red tape (e.g., it took months to get access to the primary reporting system). No automated methods for pulling reports from the back-end database. EDF files were not “to spec” according to open source “EDFlib” so additional EDF conversion software had to be written. Patient information appears in EDF annotations.
Task 2: Data Capture Major Tasks: • Copy data from media to disk • Convert EEG files to EDF • Capture Physician Reports • Label Generation Status and Issues: • 22,000+ EEG sessions have been captured from 1570+ CDs/DVDs. • Approximately 15% of the media were defective and needed multiple reads or some form of repair. • Raw data occupies about 2 TBytes of space including video files. • Conversions to EDF averaged 1 file per minute with most of the time spent writing data to disk. The process generates three files: an EEG file in EDF format, an impedance report, and a test report that contains preliminary findings. • Multiple EDF files per session due to the way physicians annotate EEGs.
Task 2: TUH-EEG at a Glance • Number of Sessions: 22,000+ • Number of Patients: ~15,000 (one patient has 42 EEG sessions) • Age: 16 years to 90+ • Sampling: 16-bit data sampled at 250 Hz, 256 Hz or 512 Hz • Number of Channels:variable • Number of Channels: ranges from [28, 129] (one annotation channel per EDF file) Analysis of EEG Reports will follow in January’2014. • Over 90% of the alternate channel assignments can be mapped to the 10-20 configuration.
Task 2: Physician Reports • Two Types of Reports: • Preliminary Report: contains a summary diagnosis (usually in a spreadsheet format). • EEG Report: the final “signed off” report that triggers billing. • Inconsistent Report Formats: The format of reporting has changed several times over the past 12 years. • Report Databases: • MedQuist (MS Word .rtf) • Alpha (OCR’ed .pdf) • EPIC (text) • Physician’s Email (MS Word .doc) • Hardcopies (OCR’edpdf)
Task 2: Challenges and Technical Risks • Missing Physician Reports: • It is unclear how many EEG reports in the standard format will be recovered from the hospital databases. • Coverage for 2013 was good – less than 5% of the EEG Reports were missing (and we are still trying to locate these working with hospital staff). • Coverage pre-2009 could be problematic. • Our backup strategy is to use data available from preliminary reports, which contain basic classifications of normal/abnormal and when abnormal, a preliminary diagnosis. • OCR of Physician Reports: • The scanned images are noisy, resulting in OCR errors. • Takes 2 to 3 minutes per image to manually correct.
Task 3: Release Generation Major Tasks: • Deidentify and randomly sequence files so patient information can’t be traced. • Quality control to verify the integrity of the data. • Release data incrementally to the community for feedback. Status and Issues: • Patient’s name can appear in the annotations and must be redacted; format is unpredictable. • Initially, we will only release standard 20-minunte EEGs. Long-term monitoring or ambulatory EEGswill be released separately once we understand the data. • Regularization of the physician reports.
Preliminary Findings – TUH EEG • Data processing: • Classification of 12 categories that appear in EEG annotations • 103 files that had at least one instance of one of these 12 markers • 16 channels sampled at 250 Hz using a 16-bit A/D converter • Used simple aggregate features: mean, variance and peak value • Three algorithms: (1) a K nearest neighbor (kNN); (2) a neural network (NN) and (3) a random forest (RF) • Training: “Leave-one-out” cross-validation approach • Testing: closed and open-set testing • Results: performance on closed-set testing for RF is extremely encouraging and underscores the need for big data. • Pilot PRES Experiments: preliminary results on PRES detection are encouraging also (21% error), but sensitivity and specificity are low.
Accomplishments and Results • 22,000+ EEG signals online and growing(about 3,000 per year). • Approximately 2,000 EEGs from 2012 and 2013 have been resolved and prepared for deidentification/release. • Anticipated pilot release in January 2014. • Need community feedback on the value of the data and the preferred formats for the reports. • Expect additional incremental releases through 2Q’2014. • Acquired 1,400 more EEGs from the last half of 2013 (newer data can be processed much faster).
Observations • Recovering the EEG signal data was challenging due to software incompatibilities and media problems. • Recovering the EEG reports is proving to be challenging and involves five different sources of material and several generations of formats. • Dealing with the channel selection issues will be a challenge (common to ignore channel labels and deal with each channel independently).
Publications and Dissemination Activities • Publications • Harati, A., Choi, S. I., Tabrizi, M., Obeid, I., Jacobson, M., & Picone, J. (2013). The Temple University Hospital EEG Corpus. Proceedings of the IEEE Global Conference on Signal and Information Processing. Austin, Texas, USA. • Ward, C., Obeid, I., Picone, J., & Jacobson, M. (2013). Leveraging Big Data Resources for Automatic Interpretation of EEGs. Proceedings of the IEEE Signal Processing in Medicine and Biology Symposium. New York City, New York, USA. • Related Dissemination Activities • Advancing Neural Engineering Through Big Data, 1st IEEE Global Conference on Signal and Information Processing, Austin, Texas, December 4, 2013 (NSF-Funded). • IEEE Signal Processing in Medicine and Biology, Temple University, Philadelphia, Pennsylvania, December 6, 2014 (NSF-Funded).
Additional Publicly Released Background Slides • The Temple University Hospital EEG Corpus • The NEDC Community Survey • The Neural Engineering Data Consortium • Automatic Interpretation of EEGs
The Temple University Hospital EEG CorpusSynopsis:The world’s largest publicly available EEG corpus consisting of 20,000+ EEGs collectedfrom 15,000 patients, collected over 12 years. Includes physician’s diagnoses and patient medical histories. Number of channels varies from 24 to 36. Signal data distributed in an EDF format. • Impact: • Sufficient data to support application of state of the art machine learning algorithms • Patient medical histories, particularly drug treatments, supports statistical analysis of correlations between signals and treatments • Historical archive also supports investigation of EEG changes over time for a given patient • Enables the development of real-time monitoring • Database Overview: • 21,000+ EEGs collected at Temple University Hospital from 2002 to 2013 (an ongoing process) • Recordings vary from 24 to 36 channels of signal data sampled at 250 Hz • Patients range in age from 18 to 90 with an average of 1.4 EEGs per patient • Data includes a test report generated by a technician, an impedance report and a physician’s report; data from 2009 forward inlcudes ICD-9 codes • A total of 1.8 TBytes of data • Personal informationhas been redacted • Clinical history and medication history are included • Physician notes are captured in three fields: description, impression and correlation fields.
The Neural Engineering Data ConsortiumMission:To focus the research community on a progression of research questions and to generate massive data sets used to address those questions. To broaden participation by makingdata available to research groups who have significant expertise but lack capacity for data generation. • Impact: • Big data resources enables application of state of the art machine-learning algorithms • A common evaluation paradigm ensures consistent progress towards long-term research goals • Publicly available data and performance baselines eliminate specious claims • Technology can leverage advances in data collection to produce more robust solutions • Expertise: • Experimental design and instrumentation of bioengineering-related data collection • Signal processing and noise reduction • Preprocessing and preparation of data for distribution and research experimentation • Automatic labeling, alignment and sorting of data • Metadata extraction for enhancing machine learning applications for the data • Statistical modeling, mining and automated interpretation of big data • To learn more, visit www.nedcdata.org
Automated Interpretation of EEGsGoals:(1) To assist healthcare professionals in interpreting electroencephalography (EEG) tests,thereby improving the quality and efficiency of a physician’s diagnostic capabilities; (2) Providea real-time alerting capability that addresses a critical gap in long-term monitoring technology. • Impact: • Patients and technicians will receive immediate feedback rather than waiting days or weeks for results • Physicians receive decision-making support that reduces their time spent interpreting EEGs • Medical students can be trained with the system and use search tools make it easy to view patient histories and comparable conditions in other patients • Uniform diagnostic techniques can be developed • Milestones: • Develop an enhanced set of features based on temporal and spectral measures (1Q’2014) • Statistical modeling of time-varying data sources in bioengineering using deep learning (2Q’2014) • Label events at an accuracy of 95% measured on the held-out data from the TUH EEG Corpus (3Q’2014) • Predict diagnoses with an F-score (a weighted average of precision and recall) of 0.95 (4Q’2014) • Demonstrate a clinically-relevant system and assess the impact on physician workflow (4Q’2014)