Download

1 / 23
230 likes | 389 Views
A New World of Possibilities: Suppressing Radiographic Progression with B-cell Therapy. Edward Keystone Professor of Medicine, University of Toronto, Toronto, Canada. The Challenge of Progressive Joint Damage.

E N D
A New World of Possibilities: Suppressing Radiographic Progression with B-cell Therapy Edward KeystoneProfessor of Medicine, University of Toronto, Toronto, Canada
The Challenge of Progressive Joint Damage • Structural joint damage is detectable early in the course of RA and over time is a major cause of disability in a significant proportion of patients • Early detection of erosions after disease onset, followed by aggressive treatment and appropriate monitoring are essential for sustaining normal function Pincus, et al. Arthritis Rheum 1984;27:864–872 Corbett, et al. Br J Rheumatol 1993;32:717–723 Hulsmans, et al. Arthritis Rheum 2000;43:1927–1940 Wolfe and Sharp. Arthritis Rheum 1998;41:1571–1582 Scott, et al. Rheumatology 2000;39:122–32
MTP Hand All Joint Erosions Occur Early in RA • Up to 93% of patients withRA of <2 years may have radiographic abnormalities • Erosions can be detected by MRI within 4 months of RA onset • Rate of progression is significantly (p<0.05) more rapid in the first year than in the second and third years Maximum joints affected % Year Fuchs, et al. J Rheumatol 1989;16:585–591 McQueen, et al. Ann Rheum Dis 1998;57:350–356 van der Heijde, et al. J Rheumatol 1995;22:1792–1796
A New Challenge • ~25–40% of patients treated with a TNF inhibitor fail to achieve an ACR20 response • Treatment of patients with an inadequate response to TNF inhibitors represents a major challenge Weinblatt, et al. N Engl J Med 1999;340:253–259 Weinblatt, et al. Arthritis Rheum 2003;48:35–45 Lipsky, et al. N Engl J Med 2000;343:1594–1602 Keystone, et al. Arthritis Rheum 2004;50:1400–1411
Rising to the Challenge:Targeted B-Cell Therapy in TNF Inhibitor Inadequate Responders (TNF-IRs)
TNF and/or DMARD withdrawal period REFLEX Study: Design Screen/TNF Randomisation Treatment period Randomization and/or DMARD ¯ ¯ t Long-term follow-up Rituximab + MTX(Group A) n=308 Methotrexate and anti-TNF inadequate responders Placebo + MTX (Group B) n=209 Screen Day1 Wk2 Wks 4, 8, 12, 16, 20 Wk 24 Wk 56 Rescue (Week 16) Group A: Standard of care Group B: Rituximab + MTX
Rituximab 1000mg x 2 + MTX Repeat courses Rescue (rituximab 1000 mg x 2) Placebo + MTX Wk 16 Wk 24 Wk 56 Treatment Schema
Methods: Radiological Assessments • Radiographs were scored by 2 independent assessors (blinded to treatment and sequence) • Quantitative analysis of joint damage by Genant-modified Sharp Score at 56 Weeks • Linear extrapolation from the 24-week time point for missing values • Post hoc subgroup analysis based on ACR20 response at Week 24
Patient Treatment aITT population (n=463)
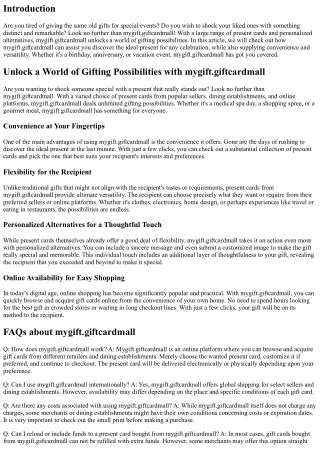
Rituximab Inhibits Radiographic Progression in TNF-IR Patients p=0.0046 2.5 2.31 p=0.0114 2.0 p=0.0006 1.5 1.32 Mean TSS changea 1.00 0.99 1.0 0.59 0.41 0.5 0.0 Total Genant-modified Joint space narrowing Erosion score Sharp score Placebo (n=184) Rituximab (n=273) Primary analysis: Radiographs within time window, linear extrapolation from Week 24 for missing values aAt Week 56 Keystone, et al. Arthritis Rheum 2006;54 (Abstract 1307)
Cumulative Distribution of Change in Total Sharp Genant Score 40 35 30 25 20 15 Sharp-Genant score Change from baseline in total 10 5 0 0 10 20 30 40 50 60 70 80 90 100 -5 -10 Cumulative proportion of patients (%) Rituximab (n=273) Placebo (n=184)
Patients With No Radiographic Changes at Week 56 Placebo (n=184) Rituximab (n=273) 70 p=0.0494 p=0.0904 61 60 53 52 50 46 40 Patients (%) 30 20 10 0 No change inerosion score No change in total Genant-modified Sharp score Primary analysis: radiographs within time window, linear extrapolation from Week 24 for missing values
Dissociation of Clinical and Radiographic Outcomes With Rituximab
Rituximab Inhibits Radiographic Progression More Effectively Than MTX Regardless of Swollen Joint Count Rituximab + MTX Placebo + MTX 3.5 3.01 3.0 2.5 2.0 1.47 Change in Genant-modified Sharp score from baseline to Week 56 1.5 1.24 1.22 0.96 0.92 1.0 0.74 0.5 -0.28 0.0 -0.5 ≤=2 3–7 8–13 >13 ≤=2 3–7 8–13 >13 (n=11) (n=16) (n=41) (n=116) (n=65) (n=52) (n=59) (n=97) Swollen joint count at Week 24 Keystone, et al. Ann Rheum Dis 2007;66(Suppl. II):431
Consistent Inhibition of Structural Damage Progression in Medically Important Subgroups of Patients
Mean change in X-ray score n=47 n=68 n=43 n=71 n=49 n=65 n=45 n=69 Q1(3, 6) Q2(6, 7) Q3(7, 8) Q4 (8, 9) Change in Sharp Genant Total Score at Week 56 by Quartiles of Baseline DAS28 Cohen, et al. Ann Rheum Dis 2007;66(Suppl. II):428
Mean change in X-ray score n=46 n=69 n=46 n=69 n=48 n=65 n=44 n=70 Q1(1, 6) Q2(6, 10) Q3(10, 16) Q4(16, 48) Change in Sharp Genant Total Score at Week 56 by Quartiles of Disease Duration Cohen, et al. Ann Rheum Dis 2007;66(Suppl. II):428
Mean change in X-ray score n=47 n=73 n=40 n=72 n=48 n=75 n=47 n=53 Q1(0, 2) Q2(2, 2) Q3(2, 2) Q4(2, 3) Change in Sharp Genant Total Score at Week 56 by Quartiles of Baseline HAQ Cohen, et al. Ann Rheum Dis 2007;66(Suppl. II):428
Mean change in X-ray score n=44 n=71 n=59 n=55 n=37 n=77 n=44 n=70 Q1(1, 19) Q2(19, 37) Q3(37, 66) Q4(66, 181) Change in Sharp Genant Total Score at Week 56 by Quartiles of Baseline Total Sharp score Cohen, et al. Ann Rhem Dis 2007;66(Suppl II):428
Change in Sharp Genant Total Score at Week 56 by Anti-CCP Status at Baseline Mean change in X-ray score n=78 n=111 n=21 n=33 n=85 n=129 Cohen, et al. Ann Rheum Dis 2007;66(Suppl. II):428
Conclusions • The REFLEX study has provided the first evidence of inhibition of structural joint damage in patients with an inadequate response or intolerance to one or more TNF inhibitors • The effect of rituximab is consistent across medically important subgroups of patients with RA • The results suggest that there is an uncoupling of the relationship between clinical and radiographic outcomes