Download
1 / 64
640 likes | 784 Views
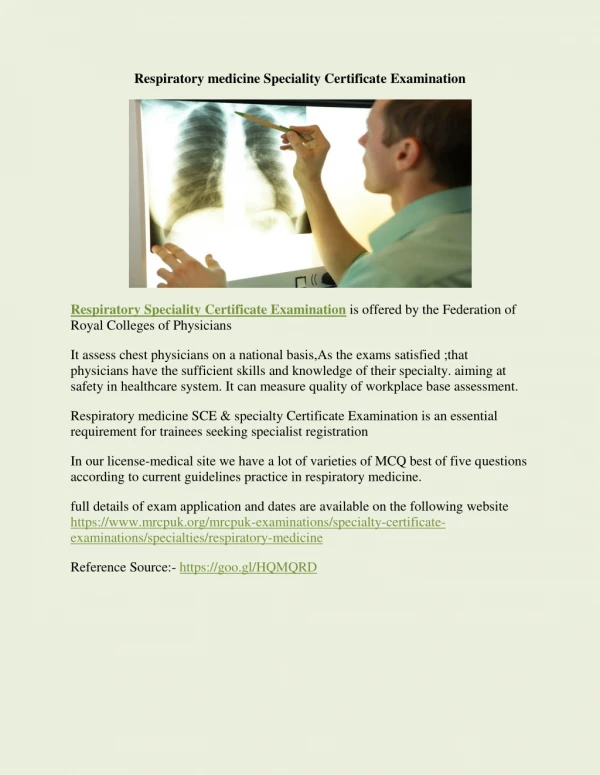
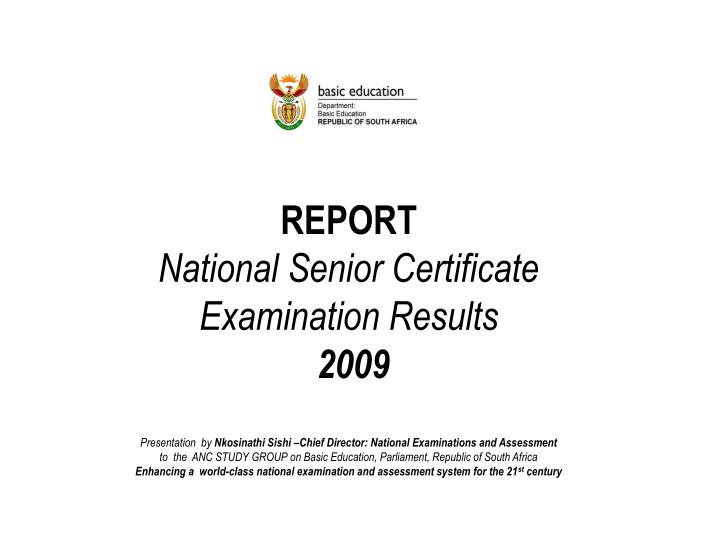
Report National Senior Certificate Examination Results 2009 Presentation by Nkosinathi Sishi –Chief Director: National Examinations and Assessment to the ANC STUDY GROUP on Basic Education, Parliament, Republic of South Africa

E N D
Report National Senior Certificate Examination Results 2009 Presentation by Nkosinathi Sishi –Chief Director: National Examinations and Assessment to the ANC STUDY GROUP on Basic Education, Parliament, Republic of South Africa Enhancing a world-class national examination and assessment system for the 21st century
Report 2009 • Examinations in South Africa-Origin and Context • Magnitude and Size • Marking • SBA • Support Programmes • Analysis • National Stats (Overall and per Subject) • Provincial Stats • District Stats • Subject Statistics • Annexure: A Provincial Results • Annexure: B District Performance • Annexure: C Subjects per province • Annexure: D List of schools divided into percentage intervals • Annexure: E List of Schools in Quintile 1 • Annexure: E2 List of Schools in Quintile 5
Timelines • 2nd NSC Examination completed on 4 December 2009 • Marking completed on 21 December 2009 • Mark capture completed by 22 December 2009 • Standardisation process 28 - 30 December 2009 • Umalusi statement on results 4 January 2010 • Results to schools on 7 January 2010 • Results to media and public on 7 January 2010
Standardisation of Results • 57 subjects were presented to Umalusi for standardisation • 41 Subjects were accepted as raw scores • 6 subjects were adjusted downwards • 10 subjects were adjusted upwards • In all cases presented no adjustments exceeded the 10% allowed either upwards or downwards • In the case of Mathematics: In 2008 298 821 took Mathematics. 136 503 passed and of these 63 038 passed at 50% desired for entry into most science and engineering HE fields. There was an outcry that P1 and p2 were too easy. Umalusi indicated that discrimination at the upper levels should be greater. In 2009 national examiners moved in that direction while strategically within the subject assessment guidelines laid down by the Department of Basic Education. • In 2009 296 165 wrote Mathematics, 133 789 passed, 85 491 passed on 40% and above and 52 866 passed on 50% and above.
Magnitude and SizeNational Examination System: 1 229 937 Schools: • Enrolments: Increased-biggest in history • National: 620 192 (includes 39 255 repeater candidates) • EC-15.6 % increase • GP-4.3% increase • LP-10.7 % increase • WC-6.3% increase Colleges • National: 520 235 • 122 921 NC (V) • 213 900 Engineering • 183 414 General Studies ABET National: 89 510
Magnitude and Size • Examination Centres: 7 2 54 NSC • Marking Centres: 114 • Markers: 35 000 • Chief markers: 828 • National examiners: 92 • External moderators: 92 • Question papers: 197 (130 National Question papers and 67 foreign languages) • QP adapted for Braille: 57 • 48 QP adapted for deaf learners • All QP, excluding English and African languages, prepared in English and Afrikaans • Subjects Entries: 4 014 732 • Moderation of SBA: A minimum of 10% portfolios moderated per subject per school
Significant Gains • 18 512 more candidates wrote the 2009 NSC examination. • 39 255 Candidates offered a second opportunity. • The quality of performances is starting to show - 40% pass and above. • Increased numbers qualifying for HE bachelor entries • 2 423 More candidates allowed admission to Bachelor studies. • 32% of candidates passing in 2009 obtained HE Bachelor qualification • 6 777 More candidates allowed admission to diploma studies. • Gap between Female & Male is closing (178 925 – Female: 155 791 Male) • Bachelor passes higher than historical trends e.g. 61 147 female and 48 550 male qualified for bachelor studies ) • Two rural provinces with greater share of poverty showing an upward trend in performance (EC & KZN)
External Quality Assurance • Umalusi approved the release of the 2009 NSC results for 8 provinces, excluding Mpumalanga • Mpumalanga results released on 6 January 2010. After further investigation into alleged leakage of national question papers prior to the start of the examinations