Download
1 / 24
240 likes | 386 Views
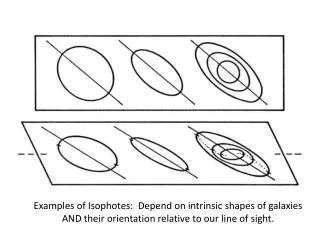
Occurrence and timing of events depend on. exposure. Risk depends on exposure. Exposure to the risk of an event. Age at first marriage and age at change in education: Person-years file. Educ: 0 = not in school full-time 1 = secondary eduction 2 = postsecondary education

E N D
Occurrence and timingofeventsdependon exposure Risk depends on exposure Exposure to the risk of an event
Age at first marriage and age at change in education: Person-years file Educ: 0 = not in school full-time 1 = secondary eduction 2 = postsecondary education Marriage [MS]: 0 = not married 1 = married All age periods prior to marriage and age at marriage are included. Source: Yamaguchi, 1991, p. 22
Exposure: examples • To risk of conception • To risk of infection (e.g. malaria, HIV) • To marriage • To risk of divorce • To risk of dying • Health risk
Exposure to risk Whenever an event or act gives rise to gain or loss that cannot be predicted Risk of the unexpected Williams et al., 1995, Risk management and insurance, McGraw-Hill, New York, p. 16
Exposure analysis • Being exposed or not • If exposed, level of exposure (intensity) • Factors affecting level of exposure (e.g. age, contacts, etc.) • Interventions may affect level of exposure • Contraceptives and sterilisation are used to prevent unwanted pregnancies • Breastfeeding prolongs postpartum amenorrhoea (PPA) • Immunisation prevents (reduces) risk of infectious disease • Lifestyle reduces/increases risk of lung cancer • Which mechanism(s) determines level of exposure • e.g. Breastfeeding stimulates production of prolactin hormone, which inhibits ovulation Hobcraft and Little, ??
Risk levels and differentialsRisk measuresPrediction of risk levelsDeterminants of differential risk levels Risk = potential variation in outcome
(Objective) risk measures • Count: Number of events during given period (observation window) • Count data • Probability: probability of an outcome: proportion of risk set experiencing a given outcome (event) at least once • Basis = Risk set • Risk set = all persons at risk at given point in time. • Rate: number of events per time unit of exposure (person-time) • Basis: duration of exposure (duration at risk) • Rate (general) = change in one quantity per unit change in another quantity (usually time; other possible measures include space, miles travelled)
Risk measures • Difference of probabilities: p1 - p2(risk difference) • Relative risk:ratio of probabilities (focus: risk factor) • prob. of event in presence of risk factor/ prob. of event in absence of risk factor (control group; reference category): p1 / p2 • Odds: odds on an outcome: ratio of favourable outcomes to unfavourable outcomes. Chance of one outcome rather than another: p1 / (1-p1) The odds are what matter when placing a bet on a given outcome, i.e. when something is at stake. Odds reflect the degree of belief in a given outcome. Relation odds and relative risk: Agresti, 1996, p. 25
Risk measures • Odds: two categories (binary data) In regression analysis, is linear predictor: = 0 + 1 x1 + 2 x2 + Parameters of logistic regression: ln(odds) and ln(odds ratio)
Risk measures Select category 3 as reference category • Odds: multiple categories (polytomous data) Parameters of logistic regression: ln(odds) and ln(odds ratio)
Risk measures • Odds ratio : ratio of odds (focus: risk indicator, covariate) • odds in target group / odds in control group [reference category]: ratio of favourable outcomes in target group over ratio in control group. The odds ratio measures the ‘belief’ in a given outcome in two different populations or under two different conditions. If the odds ratio is one, the two populations or conditions are similar. Target group: k=1; Control group: k=2 Parameters of logistic regression: ln(odds) and ln(odds ratio)
Risk measures in epidemiology Being • Prevalence: proportion (refers to status) • Incidence rate: rate at which events (new cases) occur over a defined time period [events per person-time]. Incidence rate is also referred to as incidence density (e.g. Young, 1998, p. 25; Goldhaber and Fireman, 1991). • Case-fatality ratio: proportion of sick people who die of a disease (measure of severity of disease). Is not a rate!! (Young, 1998, p. 27) Becoming Confusion: Birth defect prevalence: proportion of live births having defects Birth defect incidence: rate of development of defects among all embryos over the period of gestation (Young, 1998, p. 48)
Risk measures in epidemiology • Attributable risk (among the exposed): proportion of events (diseases) attributable to being exposed: [p1-p2]/p1 (since non-exposed can also develop disease)
(Subjective) risk measures • Subjective probability: degree of belief about the outcome of a trial or process, or about the future. It is the perception of the probability of an outcome or event. ‘It is highly dependent on judgment’ (Keynes, 1912, A treatise on probability, Macmillan, London). Keynes regarded probability as a subjective concept: our judgment (intuition, gut feeling) about the likelihood of the outcome. • See also Value-expectancy theory: attractiveness of an alternative (option) depends on the subjective probability of an outcome and the value or utility of the outcome (Fishbein and Ajzen, 1975).
In case of multiple categories,select a reference category Reference category is coded 0 Various coding schemes!
Coding schemes • Contrast coding: one category is reference category (simple contrast coding; dummy coding). Model parameters are deviations from reference category. • Indicator variable coding: indicator (0,1) variables • Cornered effect coding (Wrigley, 1985, pp. 132-136) [0,1]) • Effect coding: the mean is the reference. Model parameters are deviations from the mean. • Centred effect coding (Wrigley, 1985, pp. 132-136) [-1,+1] • Other types of coding: see e.g. SPSS Advanced Statistics, Appendix A Vermunt, 1997, p. 10
Coding schemes • Categories are coded: • Binary: [0,1], [-1,+1], [1,2] • Multiple: [0,1,2,3,..], [set of binary] e.g. 3 categories:
Coding schemes Important Selection of reference category depends on research question
Reference categories: Late [20], Males Odds on leaving home early (rather than late) Logit - Males: 74/178 = 0.416 -0.877 - Females: 135/143 = 0.944 -0.058 Odds ratio (): 0.944/0.416 = 2.27 0.820 (if we bet that a person leaves home early, we should bet on females; they are the ‘winners’ - leave home early) Var() = 2 [1/135+1/143+1/74+1/178] = 0.1725 ln = 0.819 Var(ln ) = 1/135+1/143+1/74+1/178 = 0.0335 Selvin, 1991, p. 345
Risk analysis: modelsPrediction of risk levels and differentials risk levelsProbability models and regression models • Counts Poisson r.v. Poisson distribution Poisson regression / log-linear model • Probabilities binomial and multinomial r.v. binomial and multinomial distribution logistic regression / logit model (parameter p, probability of occurrence, is also called risk; e.g. Clayton and Hills, 1993, p. 7) • Rates Occurrences/exposure Poisson r.v. log-rate model