Download
1 / 24
270 likes | 821 Views
Gas Chromatography. What is “Chromatography”. “color writing” the separation of mixtures into their constituents by preferential adsorption by a solid” (Random House College Dictionary, 1988)

E N D
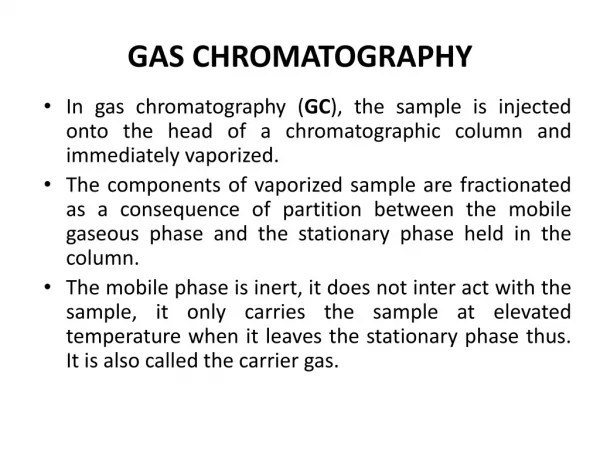
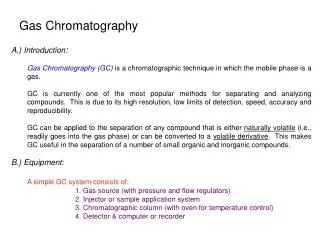
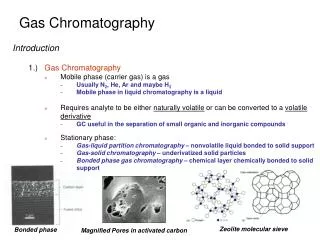
What is “Chromatography” • “color writing” • the separation of mixtures into their constituents by preferential adsorption by a solid” (Random House College Dictionary, 1988) • “Chromatography is a physical method of separation in which the components to be separated are distributed between two phases, one of the phases constituting a ______________ of large surface area, the other being a ______ that percolates through or along the stationary bed.” (Ettre & Zlatkis, 1967, “The Practice of Gas Chromatography) stationary bed fluid
Applications gas • Compound must exist as a ____ at a temperature that can be produced by the GC and withstood by the column (up to 450°C) • Alcohols in blood • Aromatics (benzene, toluene, ethylbenzene, xylene) • Flavors and Fragrances • Permanent gases (H2, N2, O2, Ar, CO2, CO, CH4) • Hydrocarbons • Pesticides, Herbicides, PCBs, and Dioxins • Solvents
Advantages of Gas Chromatography • Requires only very small samples with little preparation • Good at separating complex mixtures into components • Results are rapidly obtained (1 to 100 minutes) • Very high precision • Only instrument with the sensitivity to detect volatile organic mixtures of low concentrations • Equipment is not very complex (sophisticated oven)
Chromatogram of Gasoline 1. Isobutane2. n-Butane3. Isopentane4. n-Pentane5. 2,3-Dimethylbutane6. 2-Methylpentane7. 3-Methylpentane8. n-Hexane9. 2,4-Dimethylpentane10. Benzene11. 2-Methylhexane12. 3-Methylhexane13. 2,2,4-Trimethylpentane14. n-Heptane15. 2,5-Dimethylhexane16. 2,4-Dimethylhexane17. 2,3,4-Trimethylpentane18. Toluene19. 2,3-Dimethylhexane20. Ethylbenzene21. m-Xylene22. p-Xylene23. o-Xylene
Theory of Operation • Velocity of a compound through the column depends upon affinity for the stationary phase Area under curve is ______ of compound adsorbed to stationary phase mass Carrier gas Gas phase concentration
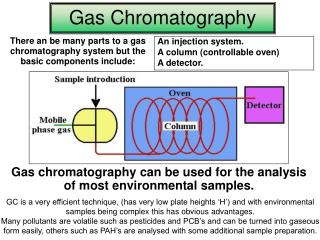
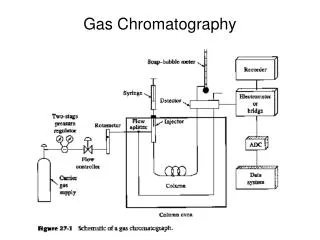
Process Flow Schematic Detector (flame ionization detector or FID) Sample injection Carrier gas (nitrogen or helium) Air Hydrogen Long Column (30 m)
Gas Chromatograph Components top view Flame Ionization Detector Injection Port Column Oven front view
Flame Ionization Detector ions • Responds to compounds that produce ____ when burned in an H2-air flame • all organic compounds • Little or no response to (use a Thermal Conductivity Detector for these gases) • CO, CO2, CS2, O2, H2O, NH3, inert gasses • Linear from the minimum detectable limit through concentrations ____ times the minimum detectable limit 107
Gas Chromatograph Output area • Peak ____ proportional to mass of compound injected • Peak time dependent on ______ through column velocity detector output time (s)
Results • Retention time (Rt) • The time required for the compound to pass through the column • Rt is a characteristic value and independent of the presence of any other compound
Calculate Rt Speed of the chart paper is 2 cm per second • Peak A • Peak B
Results • Qualitative • If the sample is suspected to be a certain compound, the sample can be “spiked” with said compound. In the read out, if there is no new peak for the “spiked” compound, the sample and the compound are the same. • Quantitative • In the read out, the area under the curve is the amount of the compound (integrate the peak)
Results • Quantitative measurement • Two Type of Peaks • Asymmetric peak • Cut the area under the peak out of the read out and mass the weight. For this to be accurate the GC must be calibrated. • Symmetric peak • Measure the height and the width at half of the height
Results • For quantitative measurement integrate the peak.
Results • An easy way to calculate the area under the curve without integral calculus is to measure the height and the width at half of the height
Calculate Area • Peak A • Peak B
Percentage of Compounds • A percentage can be calculated by dividing the area of the peak by the total area and multiplying by 100%
Ratio • With the area’s, a ratio can be calculated • A ratio of 1.88:1 of compound B to compound A
Pros for GC • Speed • Resolution • Qualitative analysis • Quantitative analysis
Pros for GC cont… • Sensitivity • Simplicity • Inexpensive
Cons for GC • Can be slow • Quantitative analysis • Destructive • Volatility