Download
1 / 17
170 likes | 266 Views
Section 2: Acceleration. Preview Key Ideas Bellringer Acceleration and Motion Calculating Acceleration Math Skills Graphing Accelerated Motion Graphing Skills. Key Ideas. What changes when an object accelerates?

E N D
Section 2: Acceleration Preview • Key Ideas • Bellringer • Acceleration and Motion • Calculating Acceleration • Math Skills • Graphing Accelerated Motion • Graphing Skills
Key Ideas • What changes when an object accelerates? • How do you calculate the acceleration of an object moving in a straight line? • How can a graph be used to find acceleration?
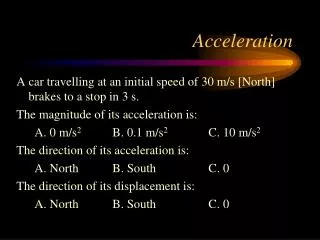
Bellringer In your study of velocity, you learned it involves both the speed of an object and the direction that the object is traveling. 1. Which of the following examples shows a change in velocity? Remember a change in velocity can be either a change in speed or a change in the direction of motion. Briefly explain your answers. a. a car coming to a stop at a stop sign b. a book sitting on a desk c. a yo-yo in motion d. a bicyclist making a left-hand turn at exactly 15 km/h
Bellringer, continued 2. In the picture shown above, a student pulls on a box with a rope. If the box is originally not moving, will its velocity increase or stay the same? In which direction (if any) will the velocity be after the student pulls on the box with the rope?
Acceleration and Motion • What changes when an object accelerates? • When an object undergoes acceleration, its velocity changes. • acceleration: the rate at which velocity changes over time; an object accelerates if its speed, direction, or both change
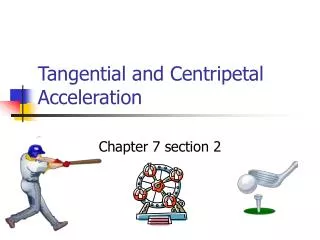
Acceleration and Motion, continued • Acceleration can be a change in speed. • An increase or decrease in speed is an acceleration. • Acceleration can also be a change in direction. • A motorcyclist who rides around the inside of a large barrel is constantly accelerating. • A person riding a Ferris wheel at an amusement park is accelerating. • The acceleration that occurs in circular motion is known as centripetal acceleration.
Calculating Acceleration • How do you calculate the acceleration of an object moving in a straight line? • The average acceleration over a given time interval can be calculated by dividing the change in the object’s velocity by the time over which the change occurs.
Calculating Acceleration, continued • Acceleration is the rate at which velocity changes. • In this book, for straight-line motion, a positive acceleration means that the object’s velocity is increasing—the object is speeding up. • Negative acceleration means that the object’s velocity is decreasing—the object is slowing down. • SI units of acceleration = meters per second per second (m/s/s), or m/s2
Math Skills Acceleration A flowerpot falls off a second-story windowsill. The flowerpot starts from rest and hits the sidewalk 1.5 s later with a velocity of 14.7 m/s. Find the average acceleration of the flowerpot. 1. List the given and the unknown values. Given:time,t = 1.5 s initial velocity,vi = 0 m/s final velocity,vf = 14.7 m/s down Unknown:acceleration, a = ? (m/s2 and direction)
Math Skills, continued 3. Insert the known values into the equation, and solve. 2. Write the equation for acceleration.
Graphing Accelerated Motion • How can a graph be used to find acceleration? • The slope of a straight line on a speed vs. time graph is equal to the acceleration.
Graphing Accelerated Motion, continued • Acceleration can also be seen on a distance vs. time graph. • The distance vs. time graph is not a straight line when the velocity is not constant. • This curved line indicates that the object is under acceleration.
Graphing Skills Graphing Acceleration A bus traveling on a straight road at 20 m/s uniformly slows to a stop over 20 s. The bus remains stopped for 20 s, then accelerates at a rate of 1.5 m/s2 for 10 s, and then continues at a constant speed. Graph speed vs. time for 60 s. What is the bus’s final speed? 1. Determine the x-axis and the y-axis of your graph. The x-axis will indicate time, t, measured in s. The y-axis will indicate speed, v, measured in m/s.
Graphing Skills, continued 2. Starting from the origin, graph each section of the motion. • Draw and connect the first two points: t = 0 s, v = 20 m/s t = 20 s, v = 0 m/s B. Draw a horizontal line from t = 20 s to t = 40 s at v = 0 m/s. C. Starting at t = 40 s and v = 0 m/s, draw a line with a slope of 1.5 m/s2. D. Draw a horizontal line from t = 50 s to t = 60 s at v = 15 m/s.
Graphing Skills, continued 3. Read the graph to find the final speed. At time t = 60 s, the speed is 15 m/s.