Download
1 / 1
10 likes | 120 Views
IDENTIFICATION OF THE FAULT PLANE AND A SIMPLE 3D VISUALIZATION TOOL Petra Adamová, Jiří Zahradník Charles University in Prague e-mail: adamova@karel.troja.mff.cuni.cz. Abstract

E N D
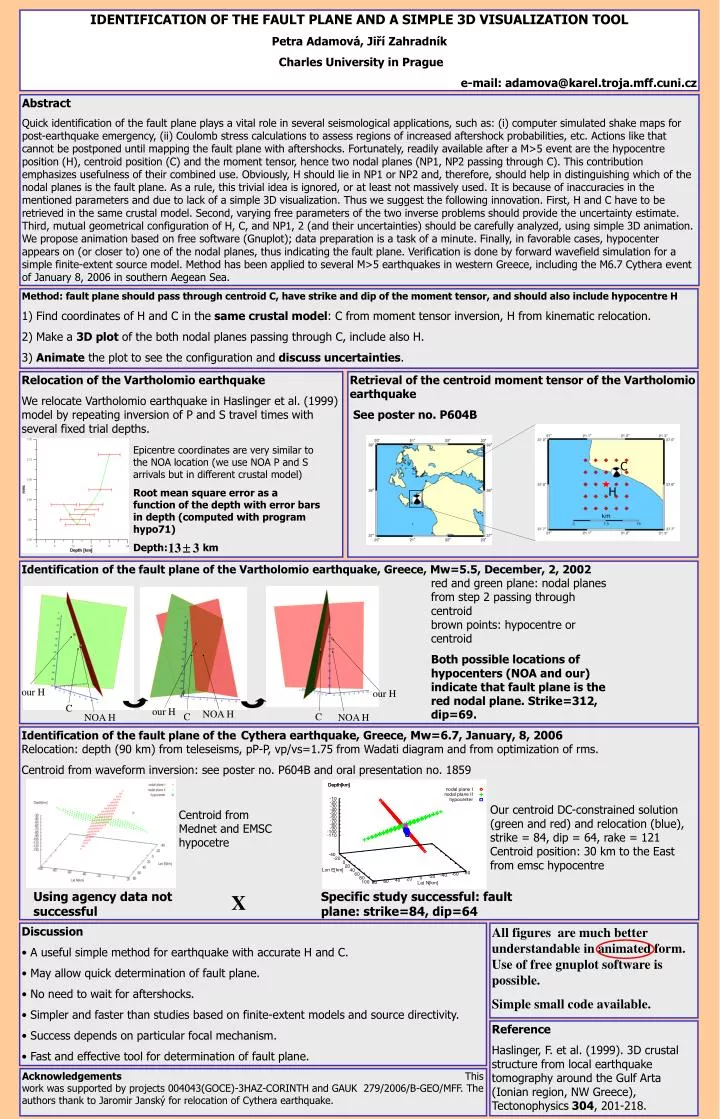
IDENTIFICATION OF THE FAULT PLANE AND A SIMPLE 3D VISUALIZATION TOOL Petra Adamová, Jiří Zahradník Charles University in Prague e-mail: adamova@karel.troja.mff.cuni.cz Abstract Quick identification of the fault plane plays a vital role in several seismological applications, such as: (i) computer simulated shake maps for post-earthquake emergency, (ii) Coulomb stress calculations to assess regions of increased aftershock probabilities, etc. Actions like that cannot be postponed until mapping the fault plane with aftershocks. Fortunately, readily available after a M>5 event are the hypocentre position (H), centroid position (C) and the moment tensor, hence two nodal planes (NP1, NP2 passing through C). This contribution emphasizes usefulness of their combined use. Obviously, H should lie in NP1 or NP2 and, therefore, should help in distinguishing which of the nodal planes is the fault plane. As a rule, this trivial idea is ignored, or at least not massively used. It is because of inaccuracies in the mentioned parameters and due to lack of a simple 3D visualization. Thus we suggest the following innovation. First, H and C have to be retrieved in the same crustal model. Second, varying free parameters of the two inverse problems should provide the uncertainty estimate. Third, mutual geometrical configuration of H, C, and NP1, 2 (and their uncertainties) should be carefully analyzed, using simple 3D animation. We propose animation based on free software (Gnuplot); data preparation is a task of a minute. Finally, in favorable cases, hypocenter appears on (or closer to) one of the nodal planes, thus indicating the fault plane. Verification is done by forward wavefield simulation for a simple finite-extent source model. Method has been applied to several M>5 earthquakes in western Greece, including the M6.7 Cythera event of January 8, 2006 in southern Aegean Sea. • Method: fault plane should pass through centroid C, have strike and dip of the moment tensor, and should also include hypocentre H • Find coordinates of H and C in the same crustal model: C from moment tensor inversion, H from kinematic relocation. • Make a 3D plot of the both nodal planes passing through C, include also H. • Animate the plot to see the configuration and discuss uncertainties. Relocation of the Vartholomio earthquake We relocate Vartholomio earthquake in Haslinger et al. (1999) model by repeating inversion of P and S travel times with several fixed trial depths. Retrieval of the centroid moment tensor of the Vartholomio earthquake See poster no. P604B Epicentre coordinates are very similar to the NOA location (we use NOA P and S arrivals but in different crustal model) Root mean square error as a function of the depth with error bars in depth (computed with program hypo71) Depth: km C H Identification of the fault plane of the Vartholomio earthquake, Greece, Mw=5.5, December, 2, 2002 red and green plane: nodal planes from step 2 passing through centroid brown points: hypocentre or centroid Both possible locations of hypocenters (NOA and our) indicate that fault plane is the red nodal plane. Strike=312, dip=69. our H our H C our H NOA H C C NOA H NOA H Identification of the fault plane of the Cythera earthquake, Greece, Mw=6.7, January, 8, 2006 Relocation: depth (90 km) from teleseisms, pP-P, vp/vs=1.75 from Wadati diagram and from optimization of rms. Centroid from waveform inversion: see poster no. P604B and oral presentation no. 1859 Our centroid DC-constrained solution (green and red) and relocation (blue), strike = 84, dip = 64, rake = 121 Centroid position: 30 km to the East from emsc hypocentre Centroid from Mednet and EMSC hypocetre Using agency data not successful Specific study successful: fault plane: strike=84, dip=64 X • Discussion • A useful simple method for earthquake with accurate H and C. • May allow quick determination of fault plane. • No need to wait for aftershocks. • Simpler and faster than studies based on finite-extent models and source directivity. • Success depends on particular focal mechanism. • Fast and effective tool for determination of fault plane. All figures are much better understandable in animated form. Use of free gnuplot software is possible. Simple small code available. Reference Haslinger, F. et al. (1999). 3D crustal structure from local earthquake tomography around the Gulf Arta (Ionian region, NW Greece), Tectonophysics 304, 201-218. AcknowledgementsThis work was supported by projects 004043(GOCE)-3HAZ-CORINTH and GAUK 279/2006/B-GEO/MFF. The authors thank to Jaromir Janský for relocation of Cythera earthquake.