Download
1 / 60
610 likes | 751 Views
Classification & Clustering. Pieter Spronck http://www.cs.unimaas.nl/p.spronck. Binary Division of Marbles. Big vs. Small. Transparent vs. Opaque. Marble Attributes. Size (big vs. small) Transparency (transparent vs. opaque) Shininess (shiny vs. dull)

E N D
Classification & Clustering Pieter Spronck http://www.cs.unimaas.nl/p.spronck
Marble Attributes • Size (big vs. small) • Transparency (transparent vs. opaque) • Shininess (shiny vs. dull) • Colouring (monochrome vs. polychrome) • Colour (blue, green, yellow, …) • …
1 if transparent then if coloured glass then group 1 else group 3 else group 2 2 3 “Natural Grouping”
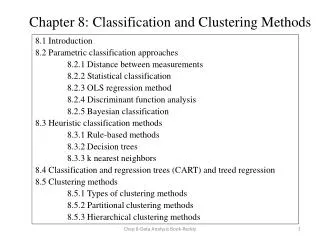
Types of Clusters • Uniquely classifying clusters • Overlapping clusters • Probabilistic clusters • Dendrograms
Dendrogram transparent opaque not clear clear
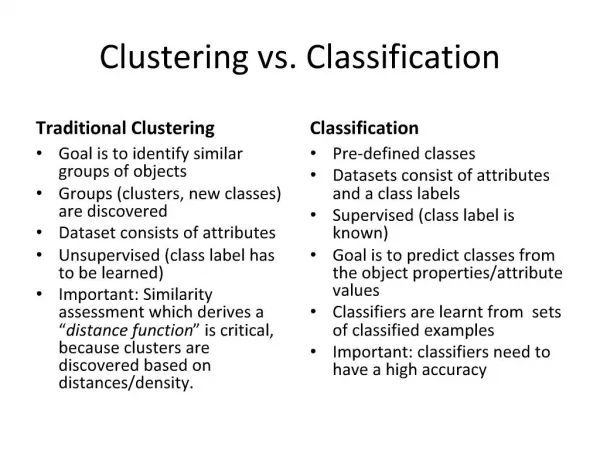
Classification • Ordering of entities into groups based on their similarity • Minimisation of within-group variance • Maximisation of between-group variance • Exhaustive and exclusive • Principal technique: clustering
Reasons for Classification • Descriptive power • Parsimony • Maintainability • Versatility • Identification of distinctive attributes
Typology vs. Taxonomy • Typology – conceptual • Taxonomy – empirical
Typology • Define conceptual attributes • Select appropriate attributes • Create typology matrix (substruction) • Insert empirical entities in matrix • Extend matrix if necessary • Reduce matrix if necessary
Defining Conceptual Attributes • Meaningful • Focus on ideal types • Order of importance • Exhaustive domains
Reduction • Functional reduction • Pragmatic reduction • Numerical reduction • Reduction by using criterion types
Criticising Typological Classification • Reification • Resilience • Problematic attribute selection • Unmanageability
Taxonomy • Define empirical attributes • Select appropriate attributes • Create entity matrix • Apply clustering technique • Analyse clusters
Lots of colours Shiny Single colour Green glass Blue Transparent Yellow Dull Big White Empirical Attributes
Selecting Attributes • Size (big/small) • Colour (yellow, green, blue, red, white…) • Colouring (monochrome/polychrome) • Shininess (shiny/dull) • Transparency (transparent/opaque) • Glass colour (clear, green, …)
Automatic Clustering Parameters • Agglomerative vs. divisive • Monothetic vs. polythetic • Outliers permitted • Limits to number of clusters • Form of linkage (single, complete, average) • …
*NNN polychrome, dull, opaque NYYY small, monochrome, shiny, transparent YYYN big, monochrome, shiny, opaque NYYN small, monochrome, shiny, opaque *NYY polychrome, shiny, transparent Automatic Clustering
*YYN monochrome, shiny, opaque Polythetic to Monothetic *NNN polychrome, dull, opaque NYYN small, monochrome,shiny, opaque NYYY small, monochrome,shiny, transparent *NYY polychrome, shiny, transparent
Analysing Clusters small, monochrome,shiny, transparent small, monochrome,shiny, opaque polychrome, dull, opaque “Stone” polychrome, shiny, transparent “Vanilla” “Classic” “Tiger”
Criticising Taxonomical Classification • Dependent on specimens • Difficult to generalise • Difficult to label • Biased towards academic discipline • Not the “last word”
Typology (conceptual) Taxonomy (empirical) Operational typology (conceptual + empirical) Operational Classification
Automated Clustering Methods • Iterative distance-based clustering: the k-means method • Incremental clustering:the Cobweb method • Probability-based clustering:the EM algorithm
k-Means Method • Iterative distance-based clustering • Divisive • Polythetic • Predefined number of clusters (k) • Outliers permitted
k = 2 attributes: size (big/small), colouring (monochrome/polychrome), shininess (shiny/dull), transparency (transparent/opaque) k-Means (pass 1) ? ?
k = 2 attributes: size (big/small), colouring (monochrome/polychrome), shininess (shiny/dull), transparency (transparent/opaque) k-Means (pass 2) Cluster average: small, polychrome, dull, opaque Cluster average: small, monochrome, shiny, transparent.
k = 2 attributes: size (big/small), colouring (monochrome/polychrome), shininess (shiny/dull), transparency (transparent/opaque) k-Means (pass 3) Cluster average: big, polychrome, dull, opaque ? Cluster average: small, monochrome, shiny, transparent.
Cobweb Algorithm • Incremental clustering • Agglomerative • Polythetic • Dynamic number of clusters • Outliers permitted
Cobweb Procedure • Builds a tree by adding instances to it • Uses a Category Utility function to determine the quality of the clustering • Changes the tree structure if this positively influences the Category Utility (by merging nodes or splitting nodes) • “Cutoff” value may be used to group sufficiently similar instances together
Category Utility • Measure for quality of clustering • The better the predictive value of the average attribute values of the instances in the clusters for the individual attribute values, the higher the CU will be
a) Pr[size=big|C1] = 1/3 b) Pr[size=big|C2] = 1/3 c) Pr[size=big] = 1/3 d) Pr[C1] = 1/2 e) Pr[size=small|C1] = 2/3 f) Pr[size=small|C2] = 2/3 g) Pr[size=small] = 2/3 h) Pr[C2] = 1/2 Category Utility for “Size” (1) C1 C2 CU = (d((a2–c2)+(e2–g2))+h((b2–c2)+(f2–g2)))/2 = 0
a) Pr[size=big|C1] = 2/3 b) Pr[size=big|C2] = 0 c) Pr[size=big] = 1/3 d) Pr[C1] = 1/2 e) Pr[size=small|C1] = 1/3 f) Pr[size=small|C2] = 1 g) Pr[size=small] = 2/3 h) Pr[C2] = 1/2 Category Utility for “Size” (2) C1 C2 CU = (d((a2–c2)+(e2–g2))+h((b2–c2)+(f2–g2)))/2 = ((1/2)((1/3)+(–1/3))+(1/2)((–1/9)+(5/9)))/2 = 1/9